Some experiments on using interactive problem sets built around mathematical Java applet constructions
At IPN, Kiel, June
30, 2003
Martti
E. Pesonen
Department of Mathematics University of Joensuu Joensuu, Finland |
| http://www.joensuu.fi/mathematics/
Martti.Pesonen@Joensuu.Fi Facts about Finland, Map, Clickable-Suomi, Eastern Finland |
Since 1997, we have had several consecutive projects aiming to increase the role of computer-assisted-learning (CAL). For example,
After 1999, interactive JavaSketchpad animations have been more or less widely used in Analysis and especially Linear Algebra.
Javasketchpad was introduced to us by Sebastian Lisken from Bielefeld, in a couple of seminars held by him and some cooperators.
Since 2001 we have conducted a four-year pilot project under the umbrella of a larger project called Virtual University of Eastern Finland (Joensuu, Kuopio and Lappeenranta). In the future a few cooperatively arranged courses will be practically “virtual”, e.g. with video lectures and computerized exercises. These developmental efforts, leading to new ways of teaching and new kinds of learning processes, have also invoked the need of follow-up and research activities.
Here we shall introduce a way to use interactive dynamical
pictures combined with appropriate problem sets in learning basic mathematical
concepts like function, binary operation and eigenvalue, and we shall also
take a look at most recent development and research work being done by
IPN and Joensuu.
Example 1.
The following picture is a part of a series of sketches
intending to show the graphical meaning of Gaussian elimination in solving
systems of linear equations of type (see 2DLines.htm)
|
The history of dynamical sketches dates back to the -70-80's and France, where the state-of-the-art computer program Cabri Géomètre was developed. Today there are several competing programs like Geometer's Sketchpad, Cinderella, Euklid. Initially these programs were used locally on stand-alone computers, and the essential idea included creating object. This feature is more difficult with Java and browser conducted sketches but, on the other hand, we can have more precise control over the students activities. This is important in creating distant learning materials. In Geometria applet construction one can also ask for evaluating the present state of the picture, and receive the comments or advice that the creator has programmed in it. This special feature in Geometria, built by Dr. Ehmke, is called response analysis.
Example 3. A Geometria sketch on sets.
Drag the points P, Q and R to such places in the Venn-diagram that
1) P belongs to A \ B
2) Q belongs to B \ A
3) R belongs to
|
Original Aims of the WorkWith these kind of pictures (or "comics") combined with properly selected problems requiring students own activity, and perhaps some calculations, too, we expect that
some degree of "transfer" would take place, i.e. students will adopt these ideas into their own professional profile |
Our general observations include:
The students had had traditional paper-and-pencil exercises
and two Maple sessions about matrix algebra before the dynamical picture
activities. Before and after the Binary Operation and Scaling demonstrations
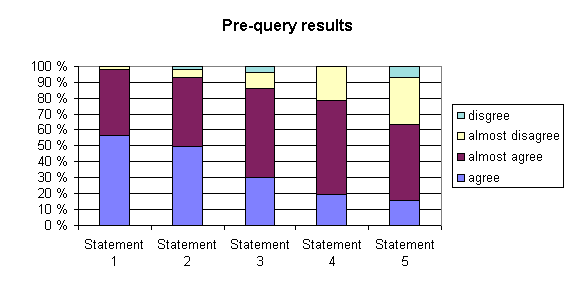
the students (about 60) were asked about their opinions to some statements,
the scale being
disagree - almost disagree - nearly agree - agree
| No | Statement, for which students agreed or nearly agreed before the activities | % |
| 1 | I believe that computers support well the teaching and learning of mathematics. | 98,2 |
| 2 | I believe that computers support well the teaching and learning of linear algebra. | 93,0 |
| 3 | I feel that, in general, working with computers is viable (suits well) for studying mathematics. | 86,0 |
| 4 | I feel that, in general, working with computers increases motivation in studying mathematics. | 78,9 |
| 5 | I feel that, in general, working with computers is advantageous for my learning results in studying mathematics. | 63,2 |

| No | Statement, for which students agreed or nearly agreed after the activities | % |
| 3' | I felt that working with computer was viable for studying mathematics. | 82,5 |
| 4' | I felt that working with computer increased motivation. | 70,2 |
| 5' | I felt that working with computer was advantageous for my learning results. | 77,2 |
The opinions were almost the same, some increase (14 %-units)
was found in statement 5. A more precise picture of the changes in opinion
can be seen in the following Table.
|
|
|
|
|
|
|
|
|
|
|
|
|
|
|
|
|
|
|
|
|
|
|
|
|
|
|
|
|
|
|
|
|
|
|
Table: Change of opinions between queries
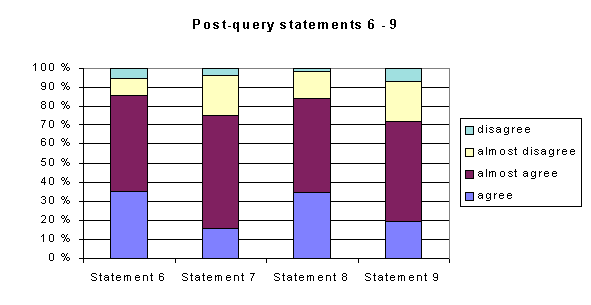
Furthermore, some more specific statements about the activities
were posed:
| 6. | Animations clarified the topic to be learned. |
| 7. | Verbal questions helped me in understanding the topic to be learned. |
| 8. | Animation based exercises done alone with the computer suited well with the topic to be learned. |
| 9. | I believe that I learned this topic better with the computer than with traditional teaching. |
and the results are shown below:

| Open-ended questions in the Post-query | |
| (a) | Which kind of role you would give to the computer in mathematics teaching? |
| (b) | On the basis of these exercises, how well do you think computers suit to learning mathematics? |
| (c) | What kind of role should CAL be given in studying these special topics? |
| (d) | What kind of difficulties you met with these exercises? |
| (a) most general answers: "a tool for visualization", "help in homework", "answer checking", but "it should not take too much resources, time etc." |
| (b) Again almost all answers were positive.
33 answers could be interpreted to mean that the use of computer suit very well in this kind of studying, while 6 (< 10 %) did not find this positive. |
| (c)
10 were quite satisfied with the exercises 11 wanted more computer exercises 7 mentioned the supportive role 11 emphasized visualizations, animations 3 wanted computer-based repetition/extra problems 9 for demonstrations, checking, calculations |
| (d) some lost their answers, some could not use the worksheets at home (browser, OS, etc. problems) |
1) definition identification problems
2) verbal-symbolic-graphic (VSG) identification problems
3) production problems (G to V and G to S).
|
|
|
Description of the operation |
|
|
|
binary operation |
|
|
|
(constant) binary operation |
|
|
|
vector v tied to a point |
|
|
|
vector v tied to a line |
|
|
|
binary operation |
|
|
|
not a function, multi-valued |
The poorest results were seen when the domain is not the whole of what is seen. One problem here is that since the students have from school some practical knowledge of functions (graph, formula), they are not open to change of the new point of view, the role of definition. Especially the strict roles of domain and co-domain is easily ignored. Another reason for poor performance in the definition identifying problems can be found
a) in the way the figure represents the operation (how
to arrange partial domains, co-domains)
b) the way the student uses it (e.g. does not drag everything)
Example 5. There were 8 correct combinations (two
animations could be combined to two expressions both)
| All 8 correct pairs | 13 |
| 7 correct pairs, no false pairs | 4 |
| 6 correct pairs, no false pairs | 7 |
| 5 correct pairs, no false pairs | 2 |
| 1 false pair, others correct | 5 |
| correct pairs at least as many as false ones | 24 |
| more false pairs than correct | 9 |
Example 6. This is how the students managed:
|
|
|
|
|
|
Symbolical form |
|
|
|
|
|
|
|
|
|
|
|
|
|
|
|
|
|
|
|
|
|
|
|
|
|
|
|
Table: Binary Operations: Production puzzle results
Function Demo discussions can be found at
http://www.joensuu.fi/mathematics/MathDistEdu/Crete2002/index.html
Many of the Javasketchpad worksheets were preliminarily
tested in the University of Caen in November 2002, and more thorough testing
is planned to take place in November 2003.
See also Lehtola's Presentation
A new ongoing study concerning the use of dynamical sketches
is supported 2003-2004 by the Academy of Finland and DAAD in Germany. The
research problem is about how the students really act when struggling with
the interactive problems.
The goal is to produce a classification system for the
different ways students play with the worksheets. This is supposed to help
in the design of more functional material.
The research was started in Autumn 2002 by an experiment
in Joensuu. The experimental worksheets can be reached from
http://www.joensuu.fi/matematiikka/kurssit/JohdantokurssiTKD.html
http://www.joensuu.fi/matematiikka/kurssit/JohdKFDRatk.html
The pre-test and post-tests were arranged within three two-hour sessions, each participated by some 20 students. Some students made this alone, even though they were encouraged to work in pairs. The test groups were Autumn 2002 first year students on an introductory course for mathematics majors. In the pre-test part there were 17 sketches concerning sets, relations and functions.
Since the students had no experience with this kind of activities, the test was started by 4 examples examined together with the teachers, one about sets (#1), one about relations (#1) and two about function (#5 and #7).
The pre-test problems, which the students had to treat
themselves, were structured as a series of short www-pages. The students
were asked to start and adjust the Camtasia-captured recording area before
answering the first problem.
The problems were
Set Theory #2 and #3
Relations #2 and #3
Functions #1–4, #6, #8–15
First observations
The reseach material consists of screen-captured video
files recorded from students’ work.
About 40 recording we captured and Lehtola examined 20
of them briefly in November 2002.
The students managed well with the exercises.
The results concerning functions were very good, at least
when compared to the Function Demo referred above.
Hints and links to definitions were used rarely. In function
problems a greater deal of students used dragging the variable x than using
the animate-facility. One student did not use either at all. In problems
where it was possible to follow the function’s behaviour also in the xy-coordinate
system, about one third did not use this. There would seems to be need
for better advice (?).
Of course there seemed to be students that did very well
with minimum of advice.
The applet techniques was found problematic, several students had difficulties in the applet invoking. There were horizontal and vertical lines missing, at least in the recordings.
Second level
The research material is being analysed more deeply by
Ehmke&Co in the Leibniz Institute in Kiel and Joensuu.
Now the video-recordings and students' answers have been
coded to SPSS, and the combining work is about to start.