Note
Siren is a tool for interactive mining and visualization of redescriptions. It is based on the greedy ReReMi algorithm and tree-based algorithms.
Using Siren, a user can explore data of his interest by interactively visualizing, editing and mining redescriptions [B.4].
The main features of Siren can be categorized into mining, visualizing and editing.
Siren offers a number of different visualizations.
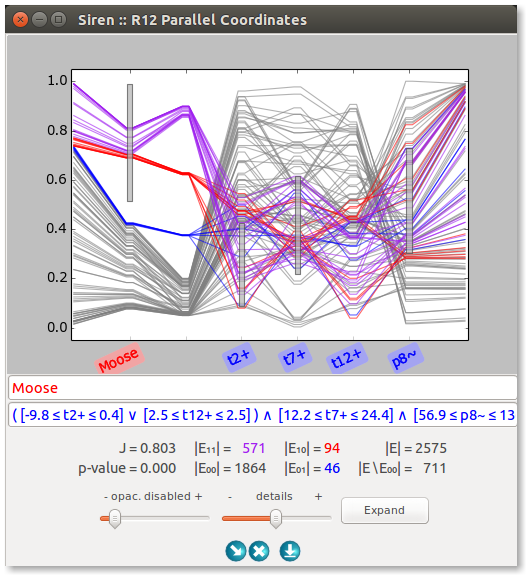
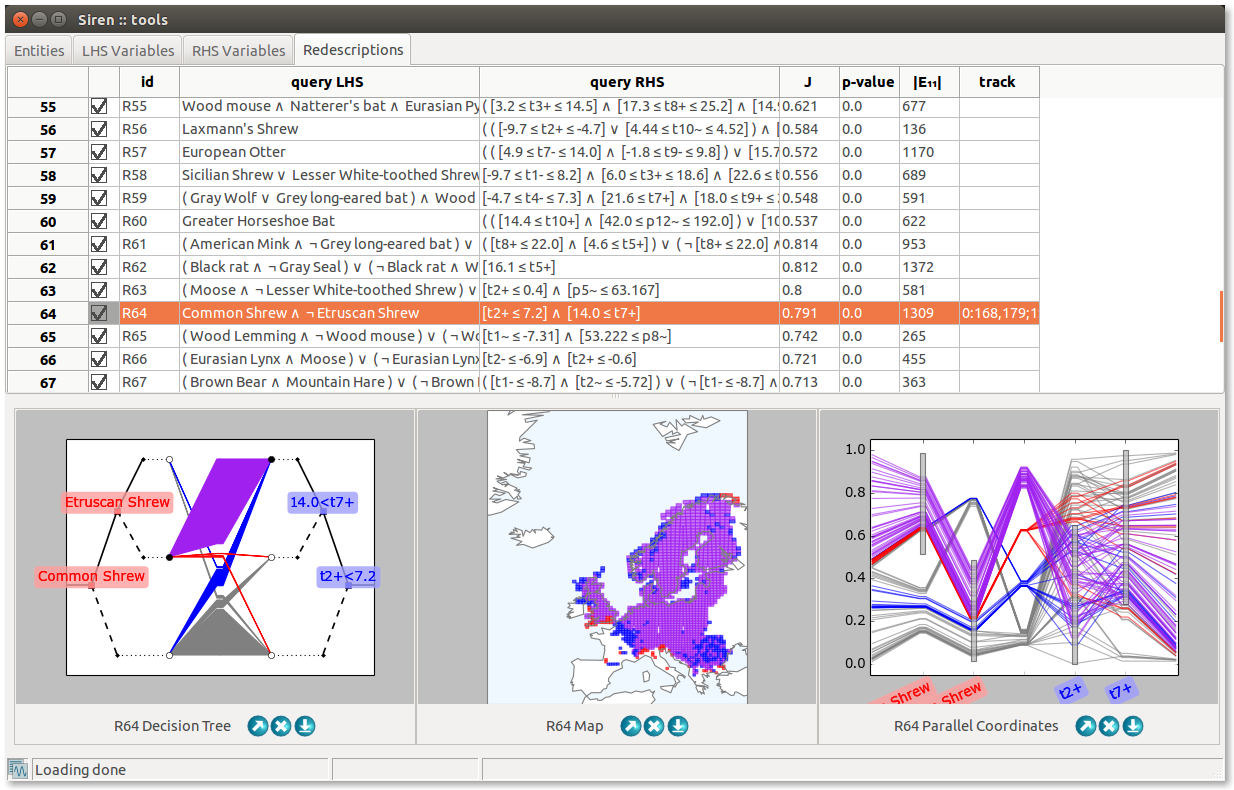
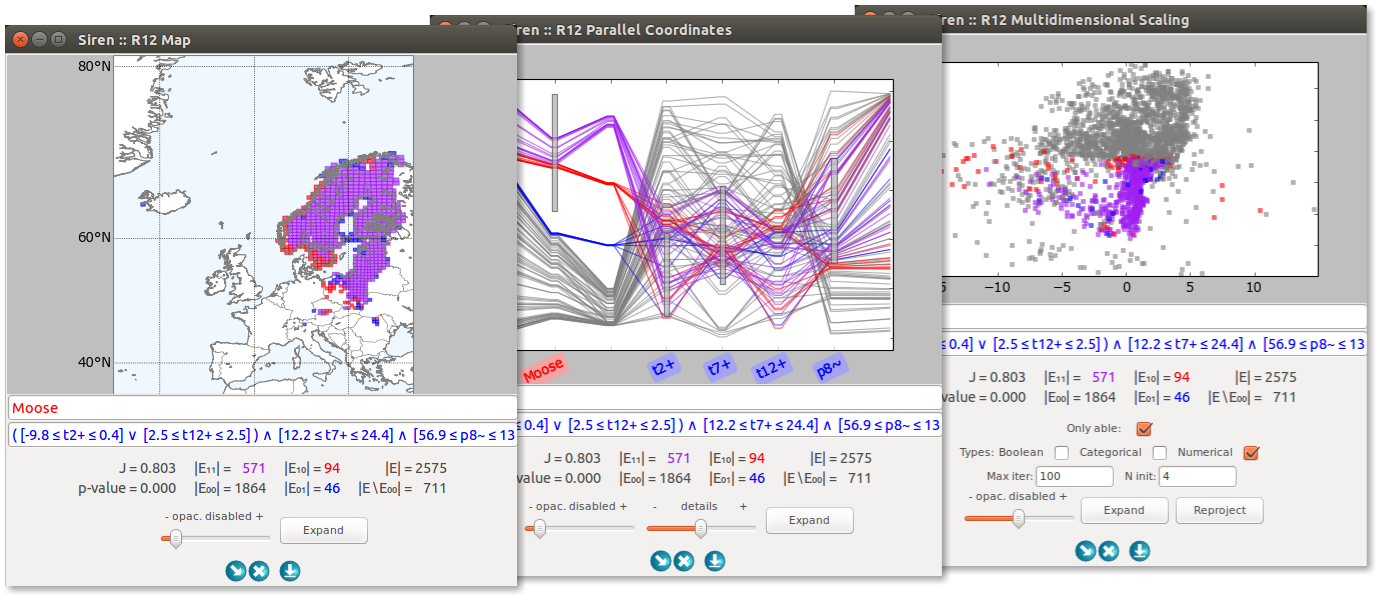
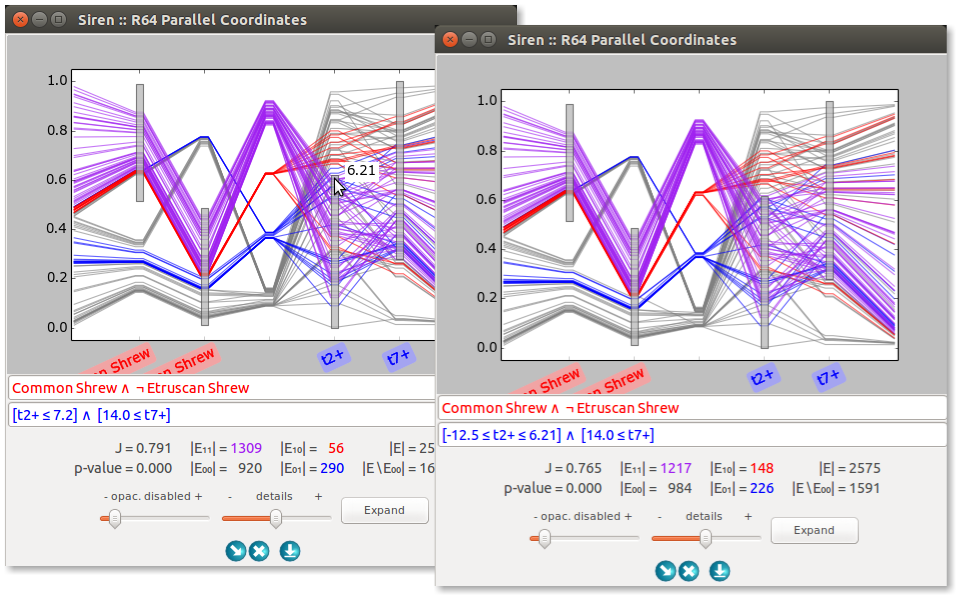
A parallel coordinates plot represents the values taken by the entites for the variable appearing in the queries. It allows to easily visualize the impact of the queries conditions on the support of the redescription.
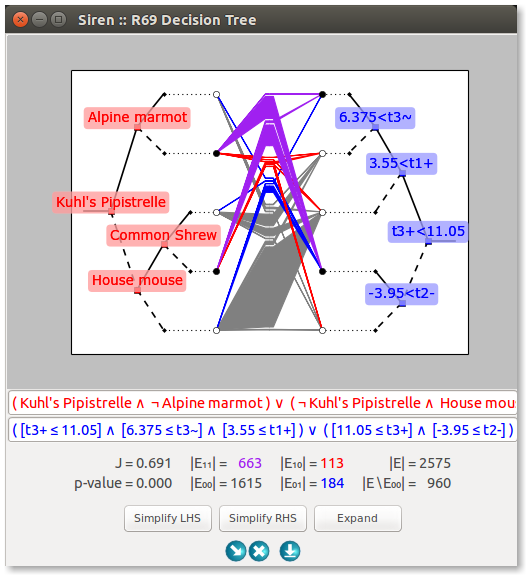
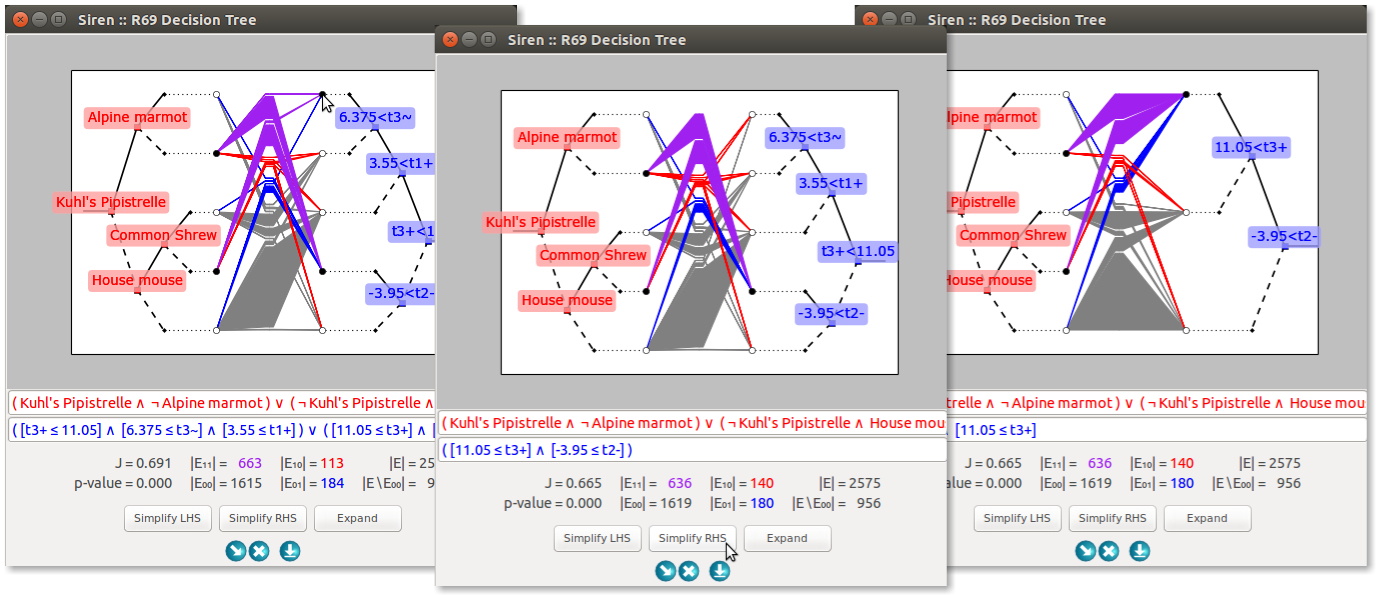
A tree diagram visualizes the queries as decision trees, linked through their leaves. It helps understand the structure of tree-based queries, which can otherwise appear rather complex.
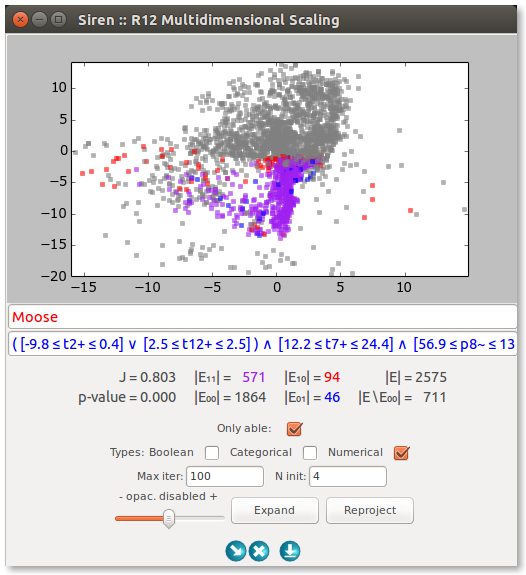
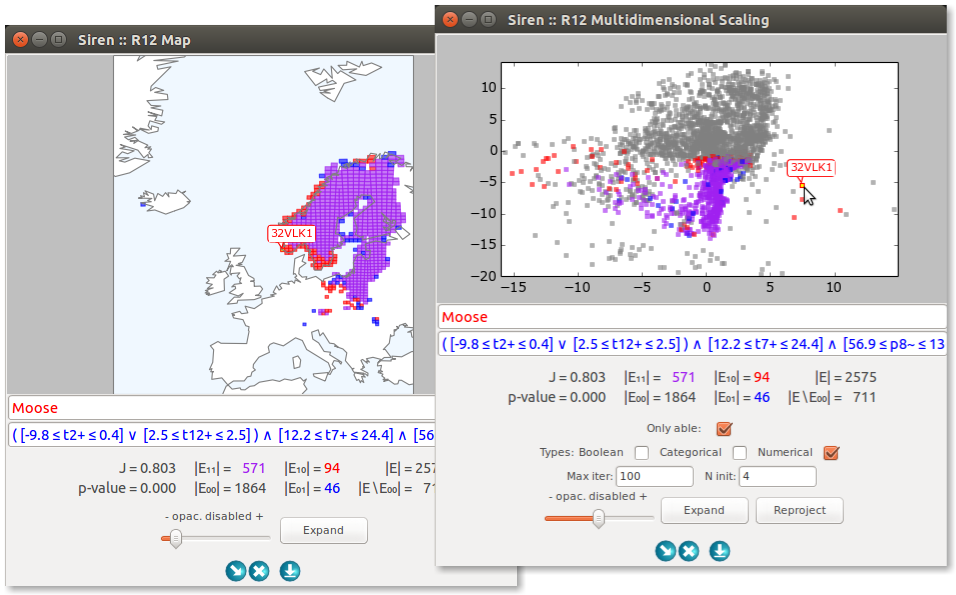
The axis projection and a number of data projections from the scikit-learn package allow to highlight different aspects of the data.
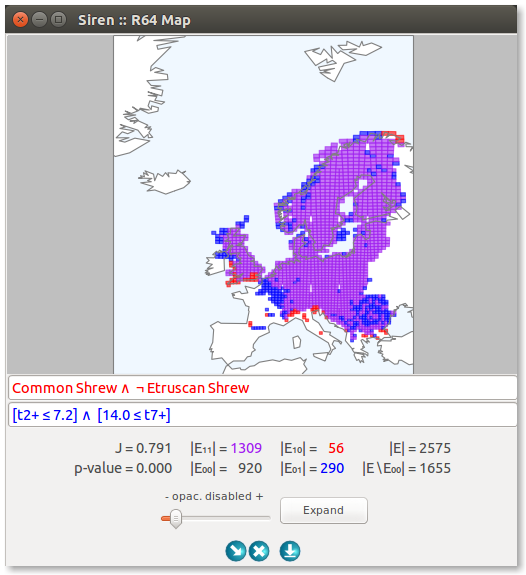
When the entities are geographic locations, we qualify the redescriptions as geospatial. In that case, it is most natural to display the redescriptions projected on a map, to show the locations where both queries hold, only the left hand side query holds and only the right hand side query holds.
Visualizations can be displayed either in their own windows separate from the main application window or in a dedicated grid of illustrations in the main application window. In addition, the main window can be split horizontaly into two frames in order to examine at the same time a list of redescriptions and several visualizations.
Existing redescriptions can be edited and the visualization and statistics will be recomputed and changes reflected in the original redescription in the list and other visualizations of that same redescription.
It is also possible to build a new redescription from scratch.
Dragging the interval boxes in the parallel coordinates plot allows to edit the redescription interactively.
Similarly, clicking on the leaves in a tree diagram allows to add and remove branches to the queries. The resulting diagram can then be simplified automatically.
The user can select single entites from a view by clicking the corresponding dot/line in a view.
In addition, the user can also select a subset of entities by drawing a enclosing polygon directly on the view.

At the core of Siren is the ReReMi redescription mining algorithm. Various modes of interaction with the mining algorithm are possible through the interface.
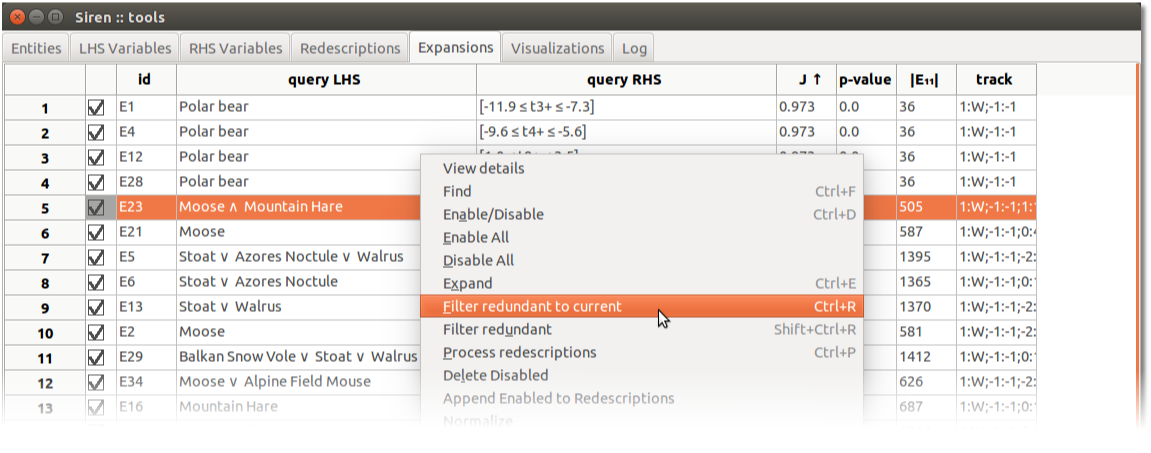
It can be useful to filter redundant redescriptions, that is, redescriptions that cover approximately the same entities even if they have (somewhat) different sets of variables.
This can be done automatically, by either selecting a redescription and asking Siren to filter out all redescriptions that are redundant with respect to the selected one, or by letting it go through the whole list of redescriptions filtering out all redescriptions that are redundant with respect to some earlier-encountered (i.e. better) redescription.
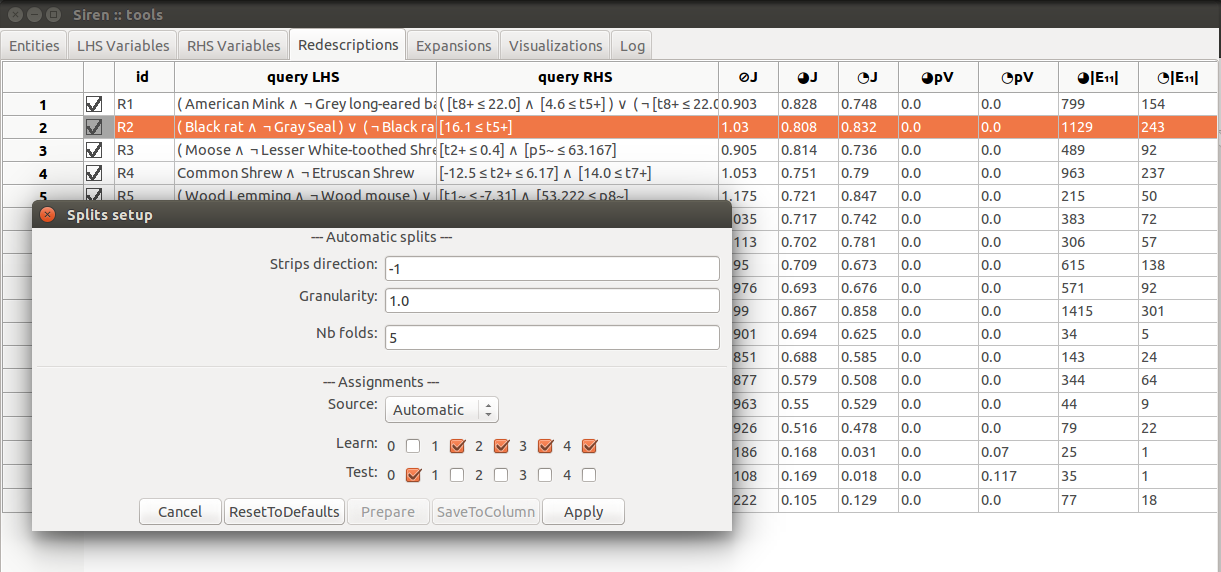
To help study how well the redescriptions mined using a particular set of parameters generalize to unseen entities, Siren allows to easily partition the data, run the algorithm on a selected subset of the data and compare accuracy and support of the results.