Note
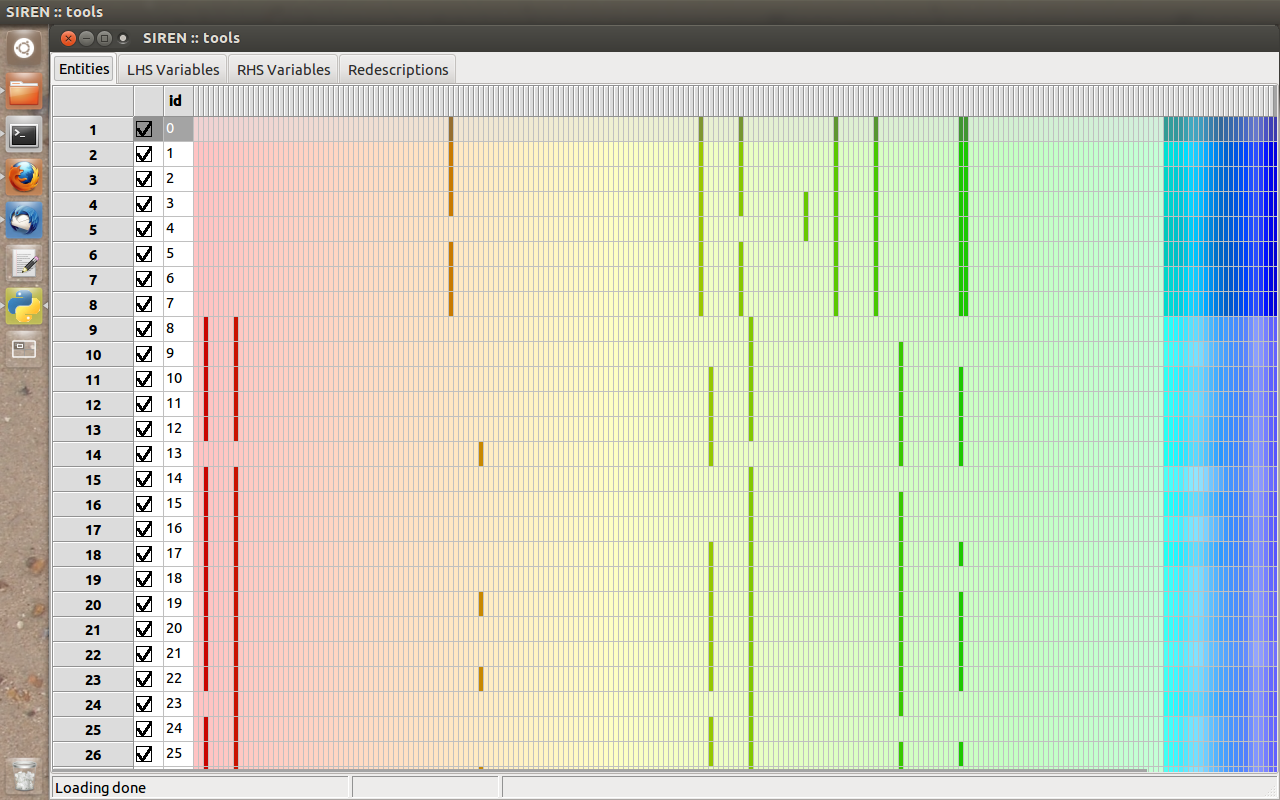
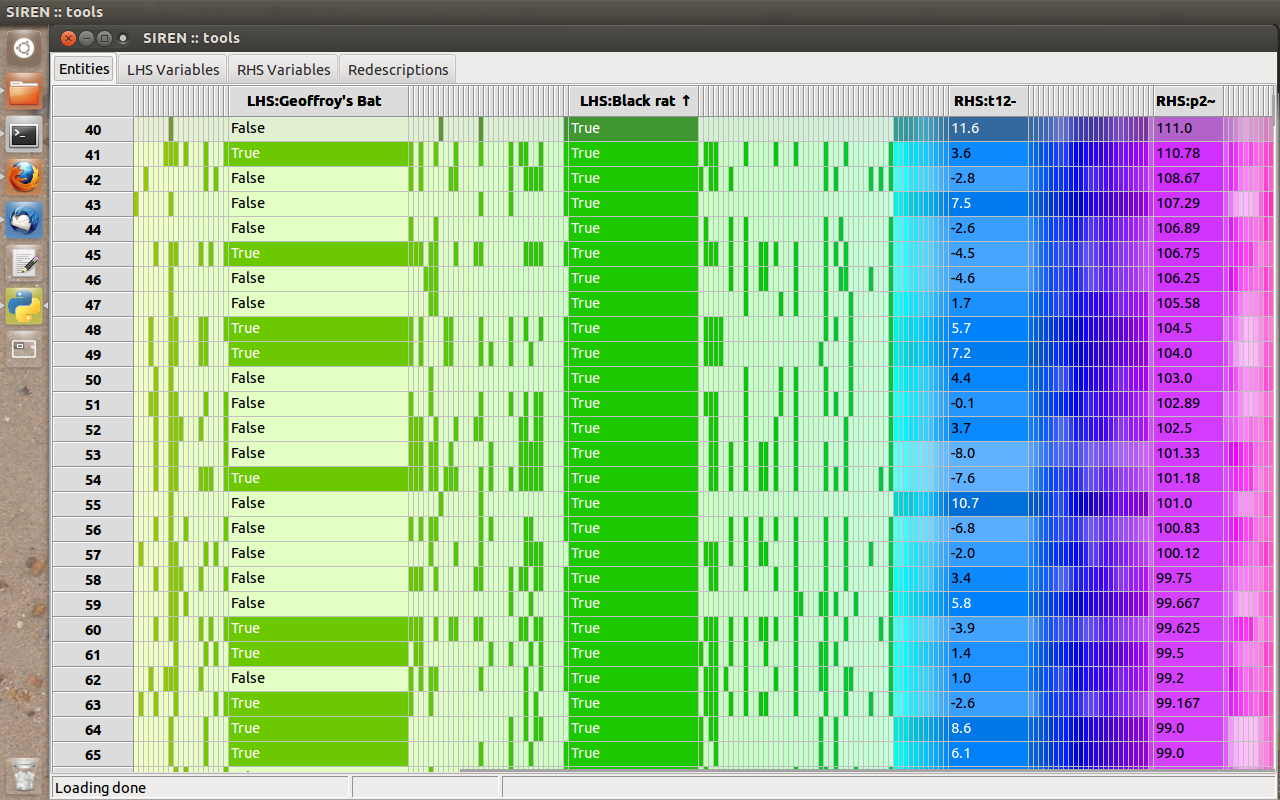
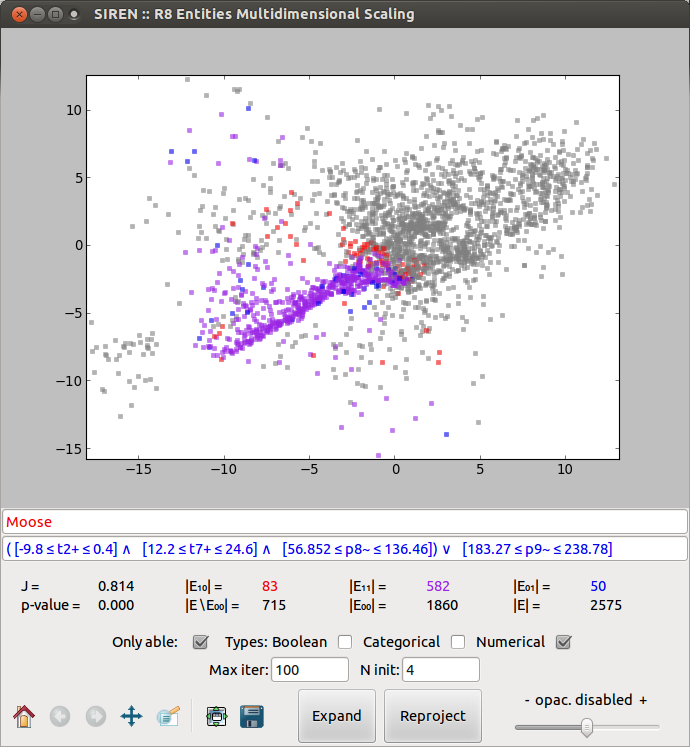
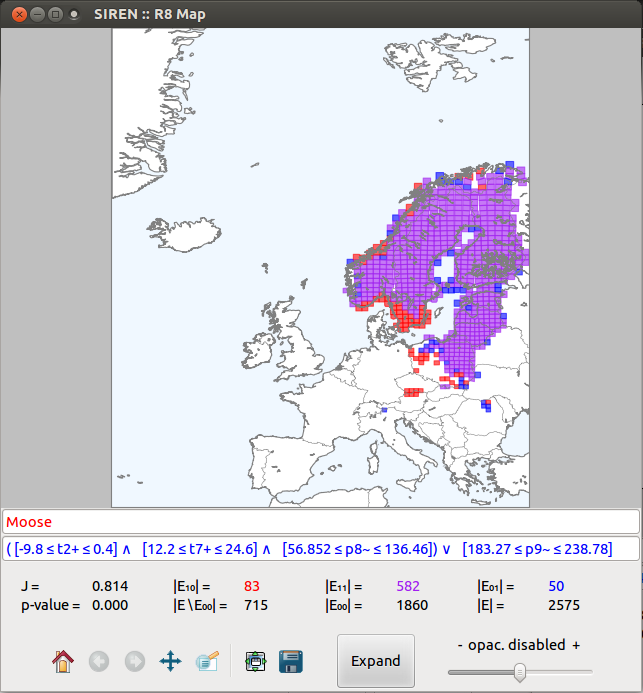
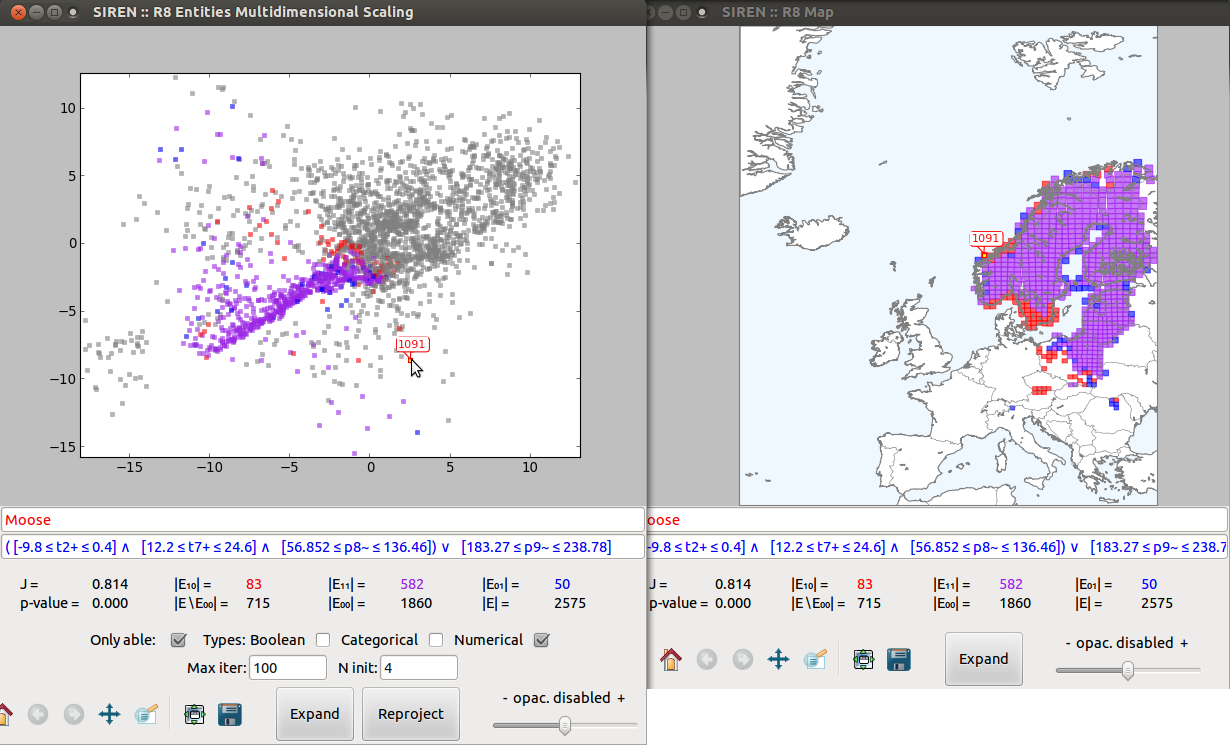
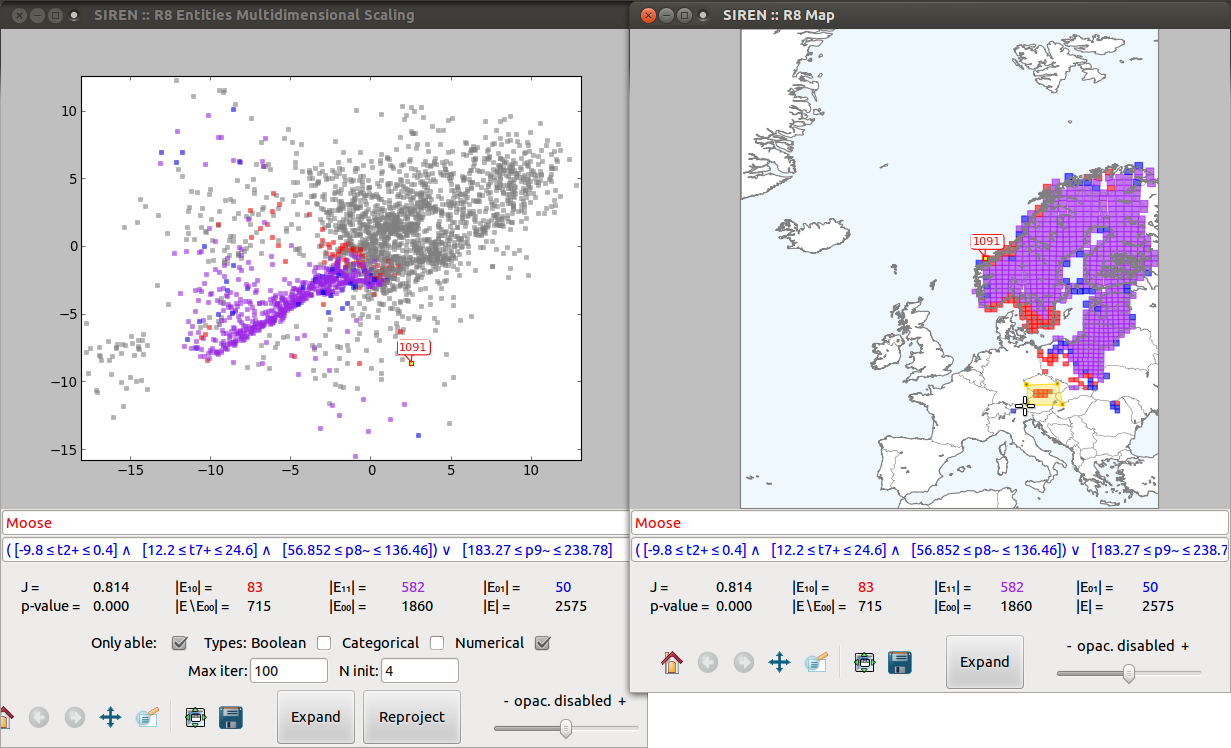
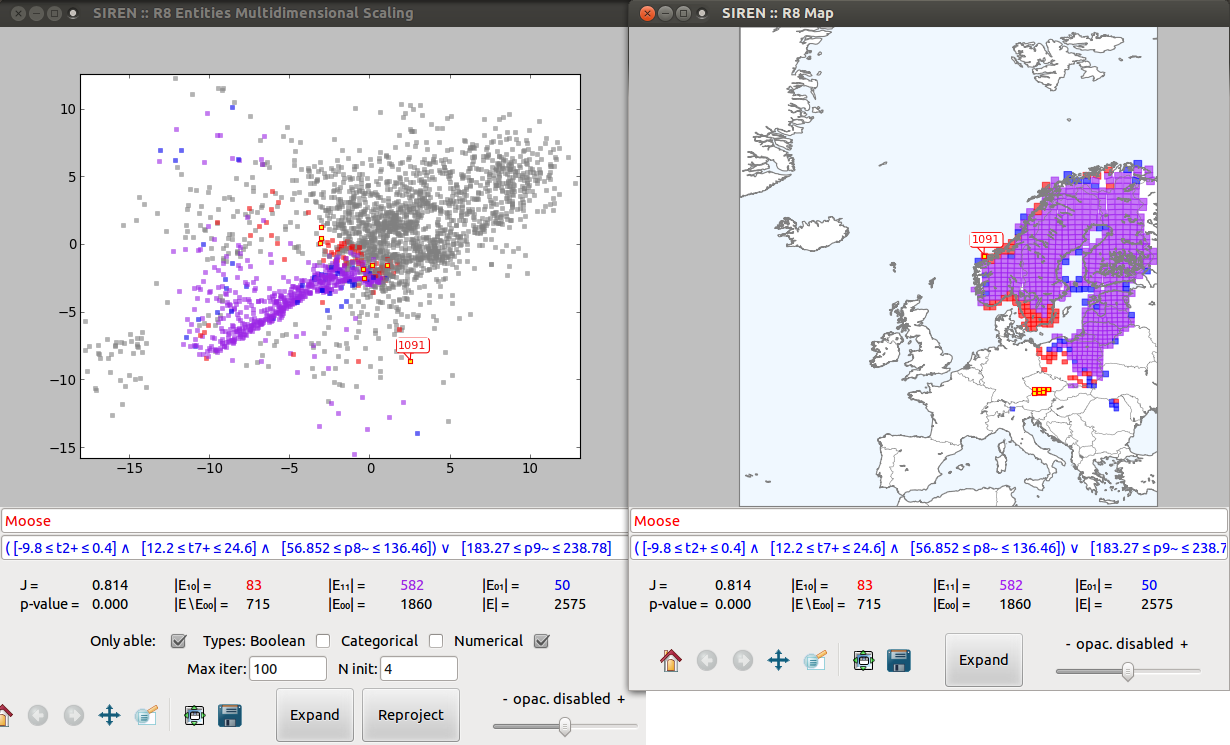
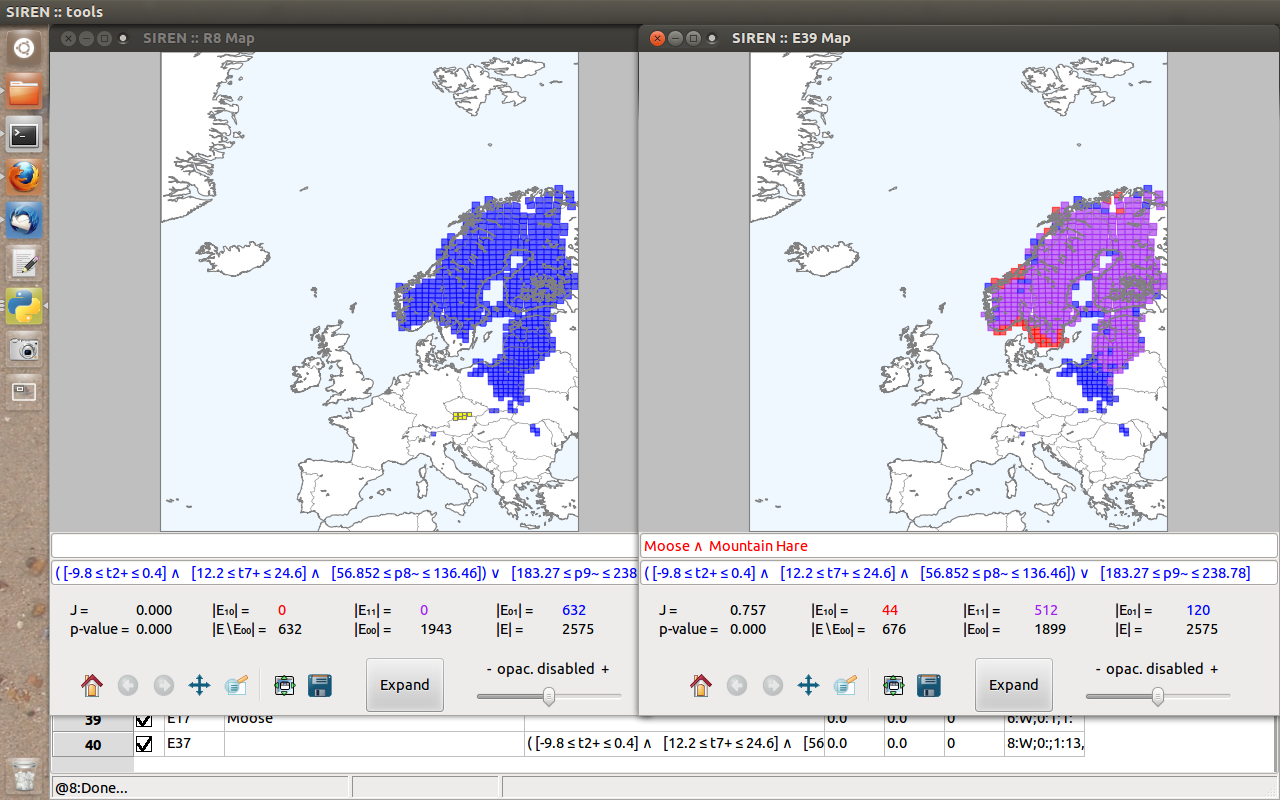
The first use-case concerns niche-finding, i.e. the problem of finding species’ bioclimatic envelope, an important task in biology.
The video tutorial provides a step by step use-case with this data.
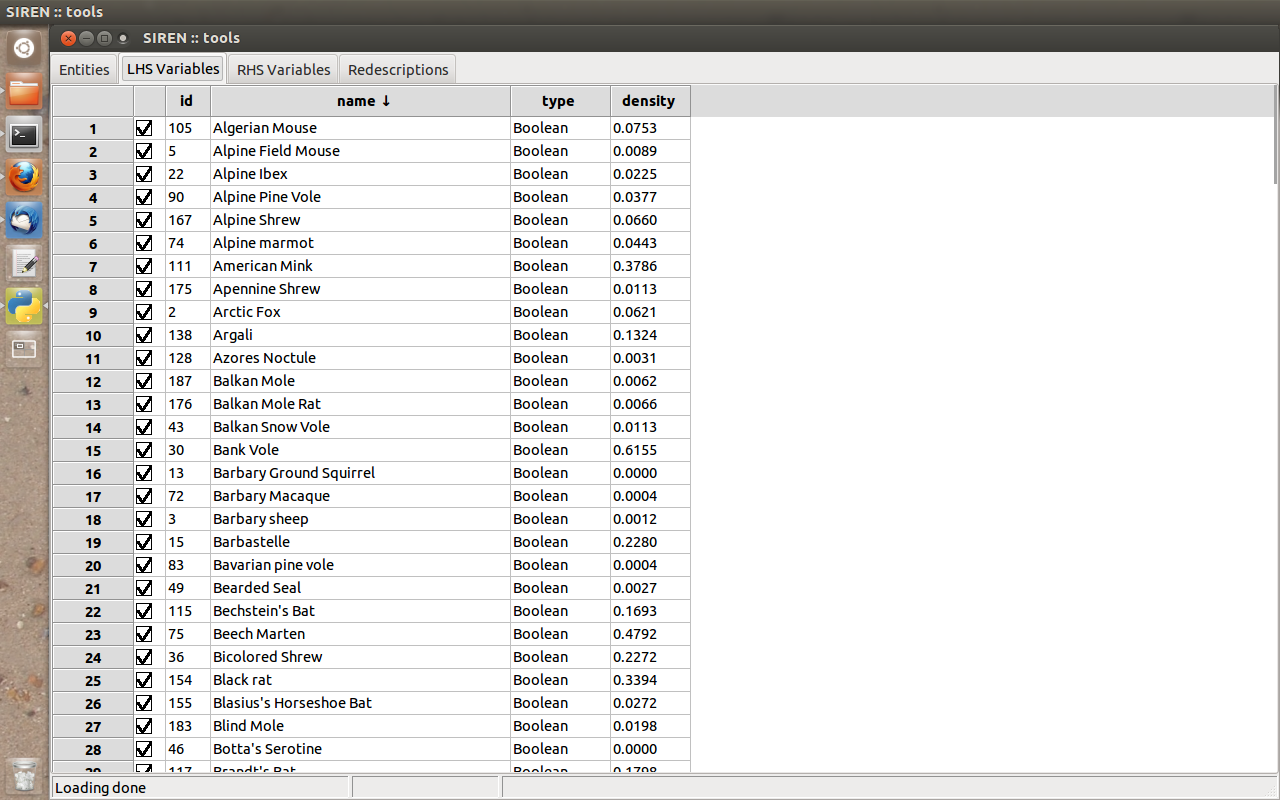
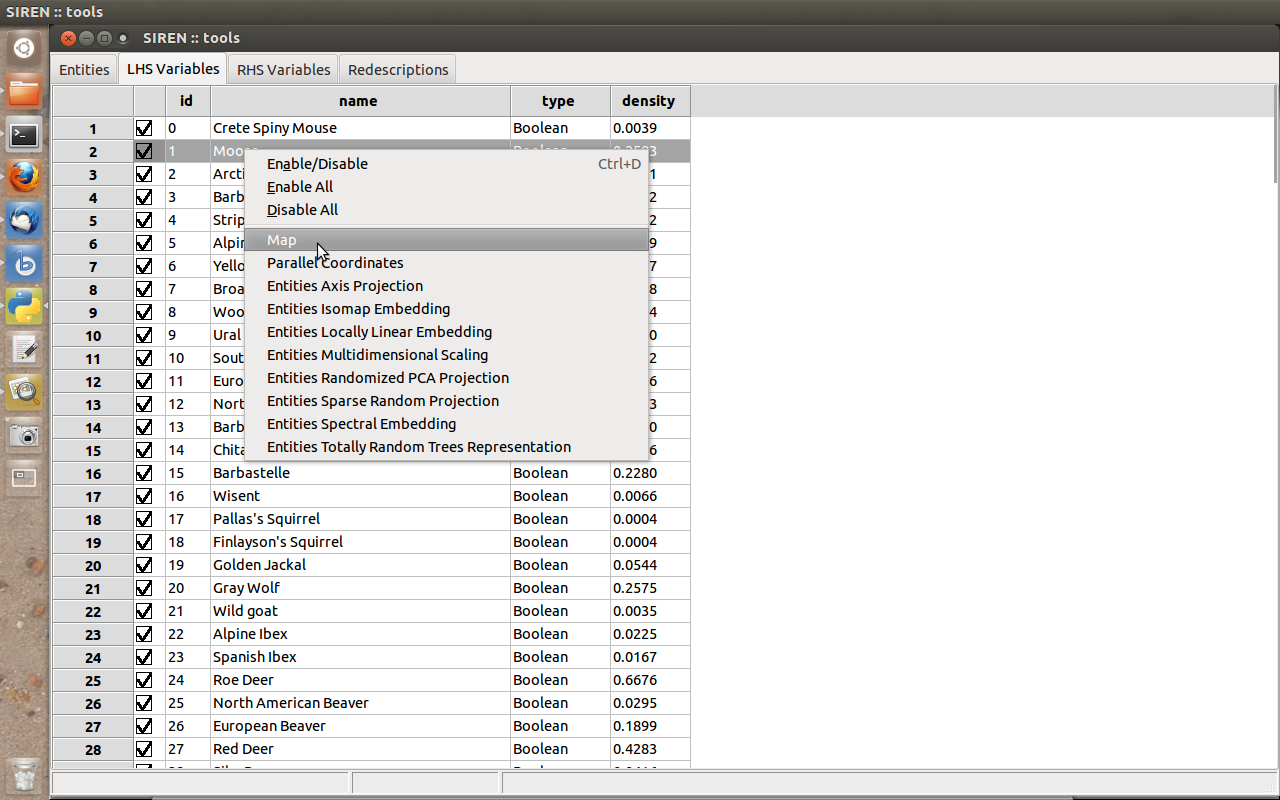
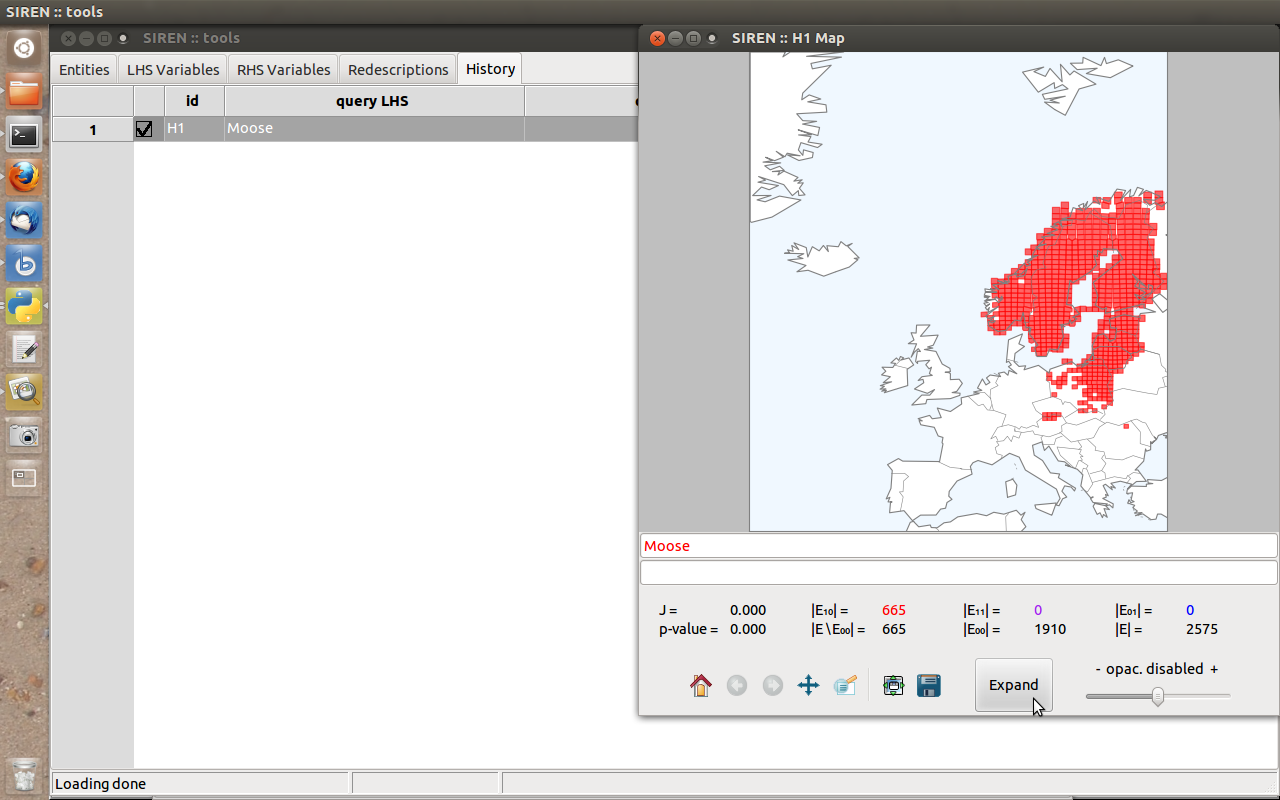
The Bio data describes spatial areas of Europe, 2575 squares of side roughly 50 kilometers. The left hand side data contains information about the mammals that live in these areas denoted with the names of the respective species. The minimum, maximum and average monthly temperatures in degrees Celsius as well as average monthly precipitation in millimeters, make up the right hand side data, denoted as +x, t-x, t=xand p=x, respectively, where x is the number of the month. The data comes from two publicly available datasets: European Mammals atlas and Worldclim climate data.

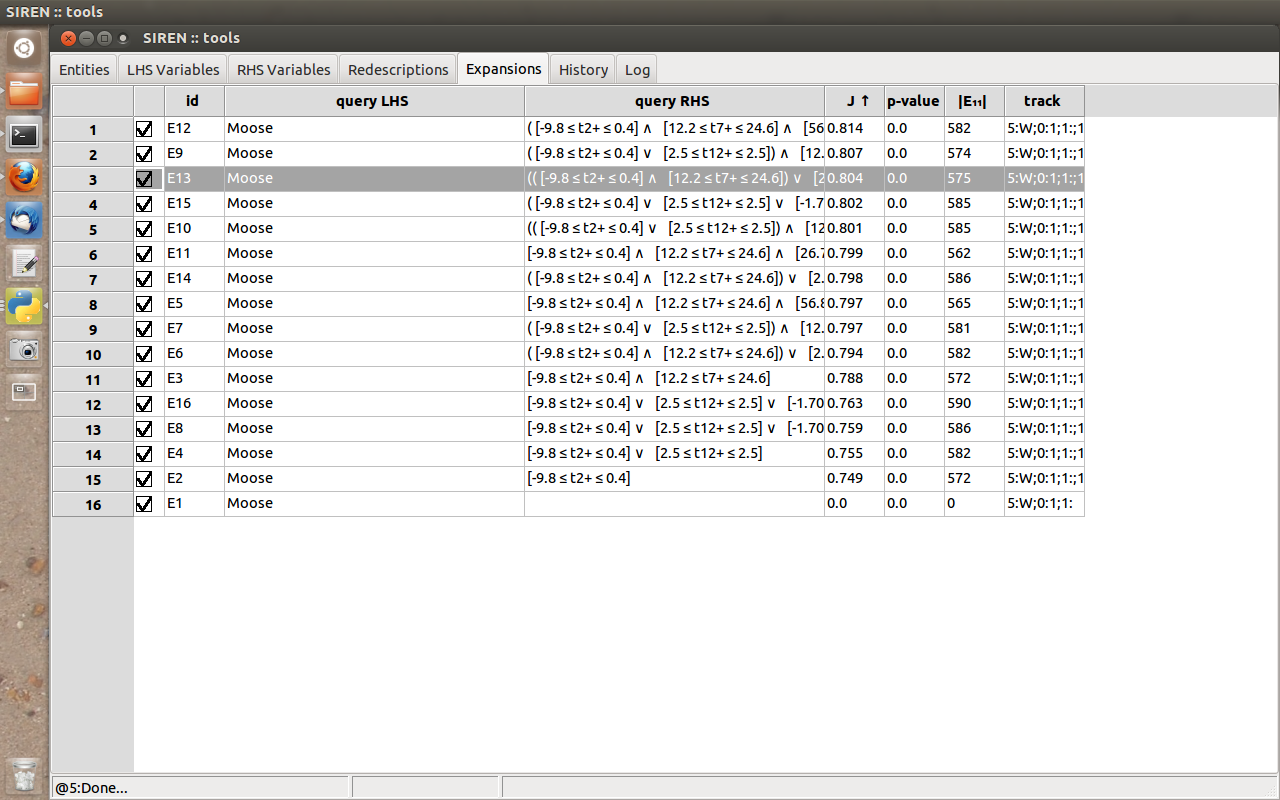
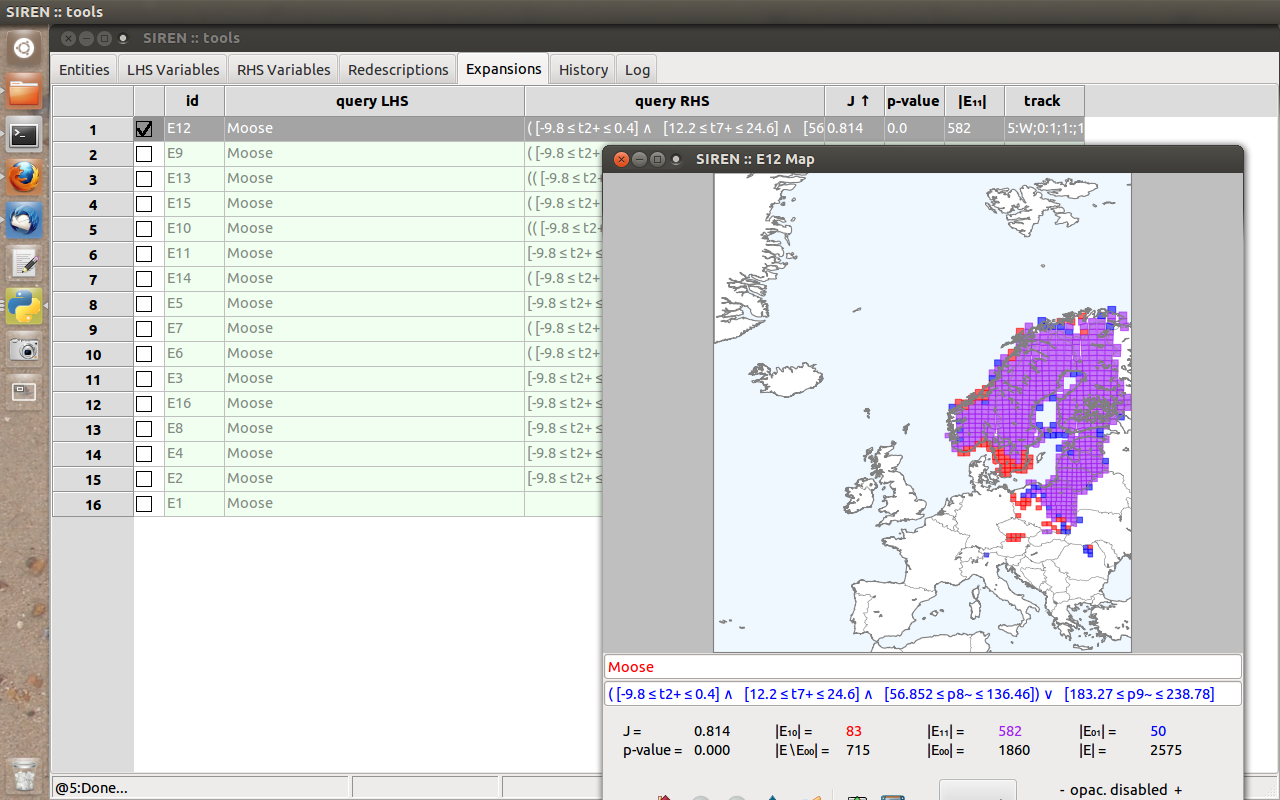
ENTER to update the redescription then choose .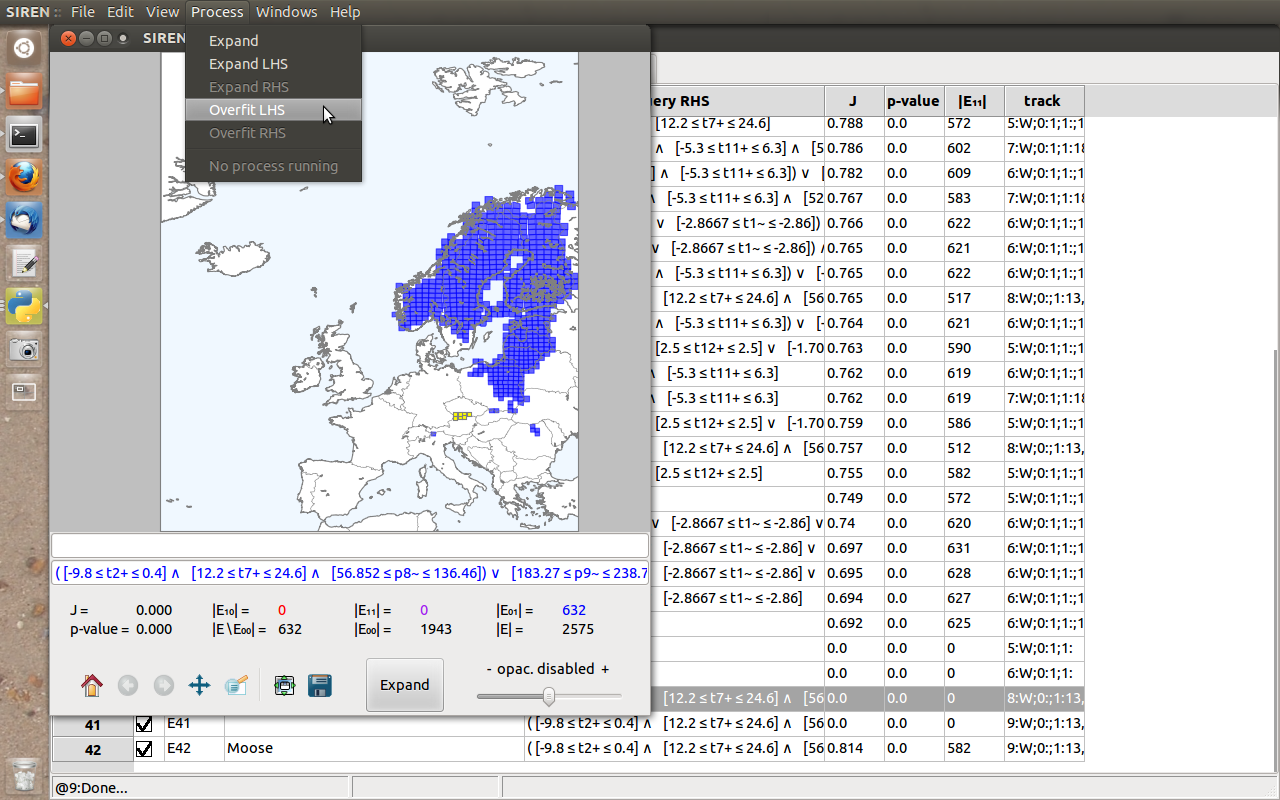
Note
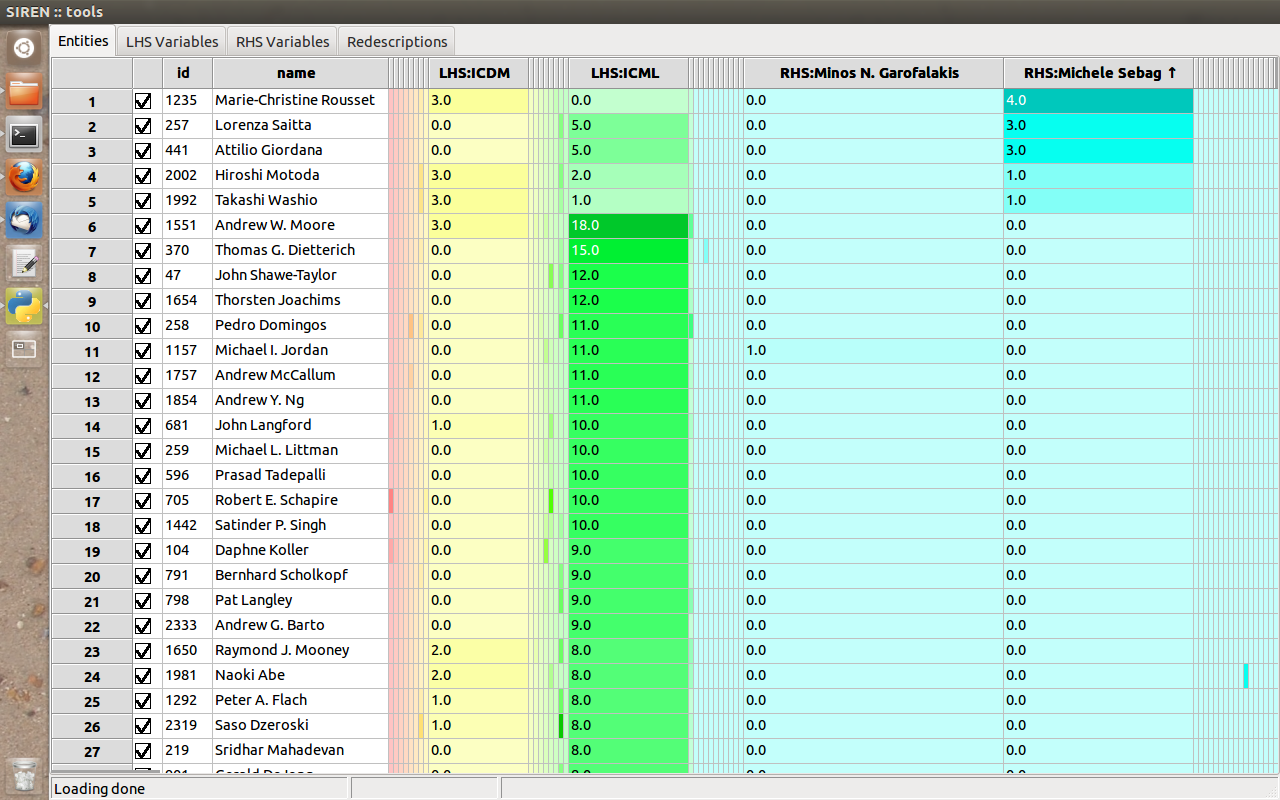
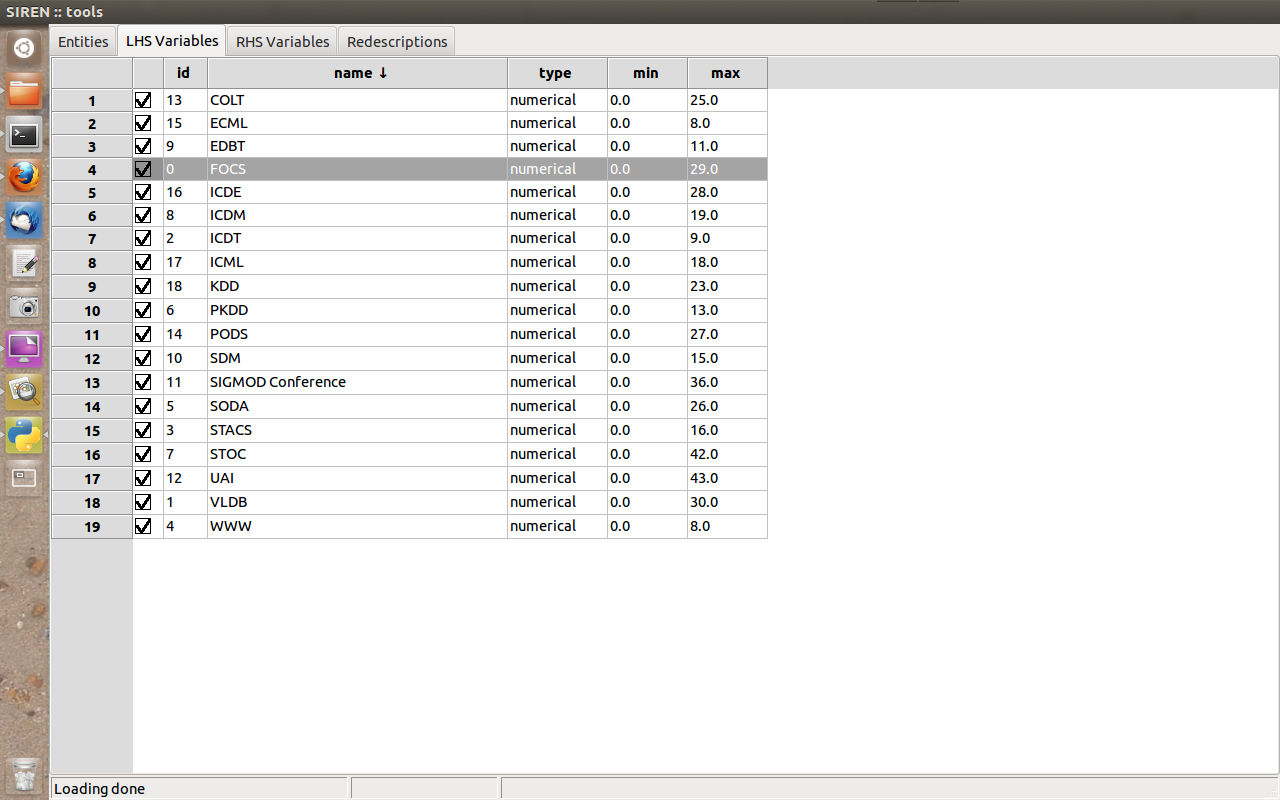
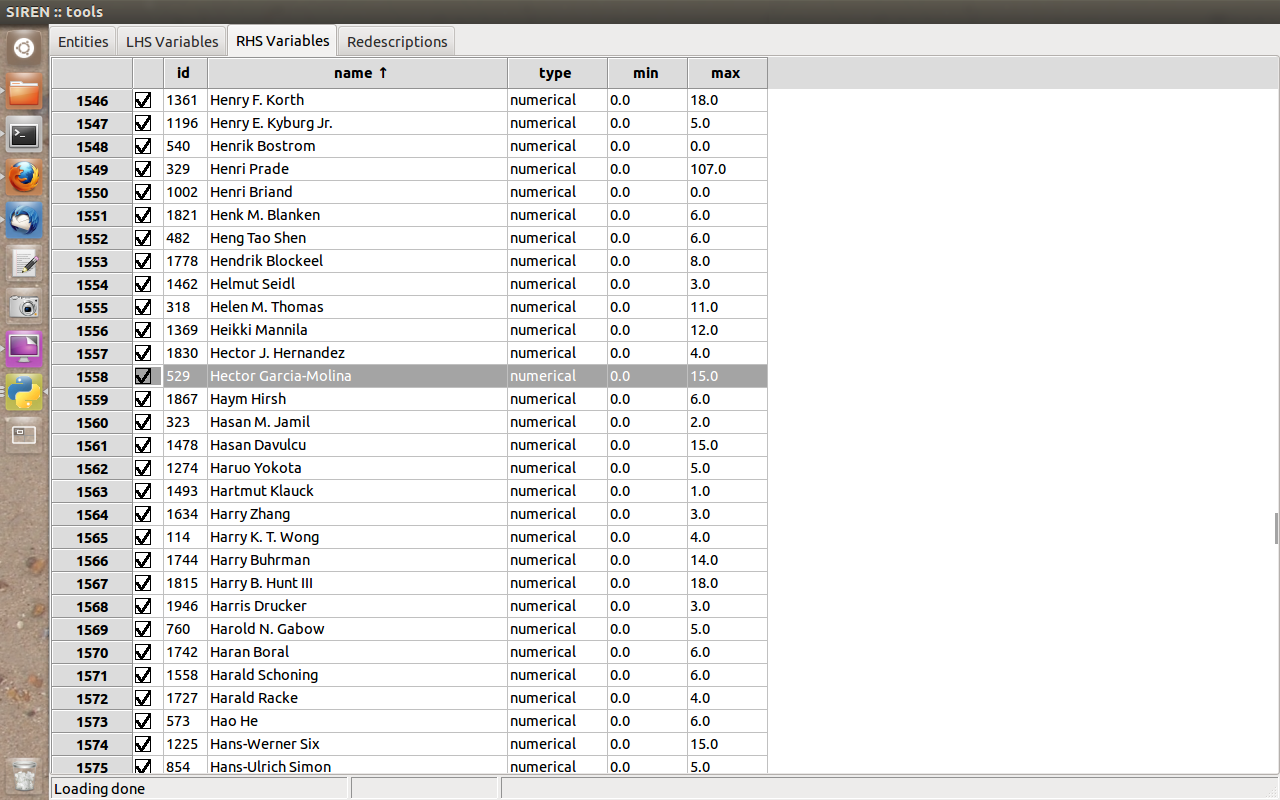
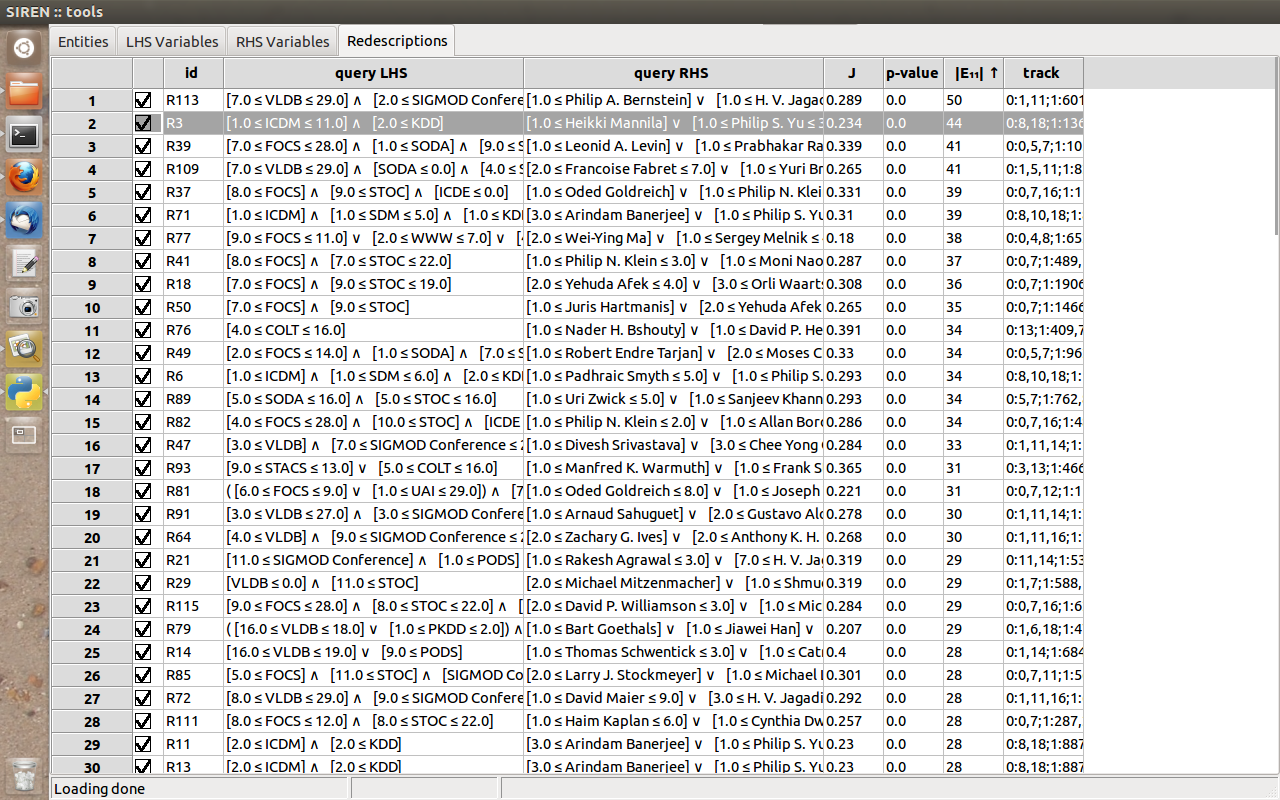
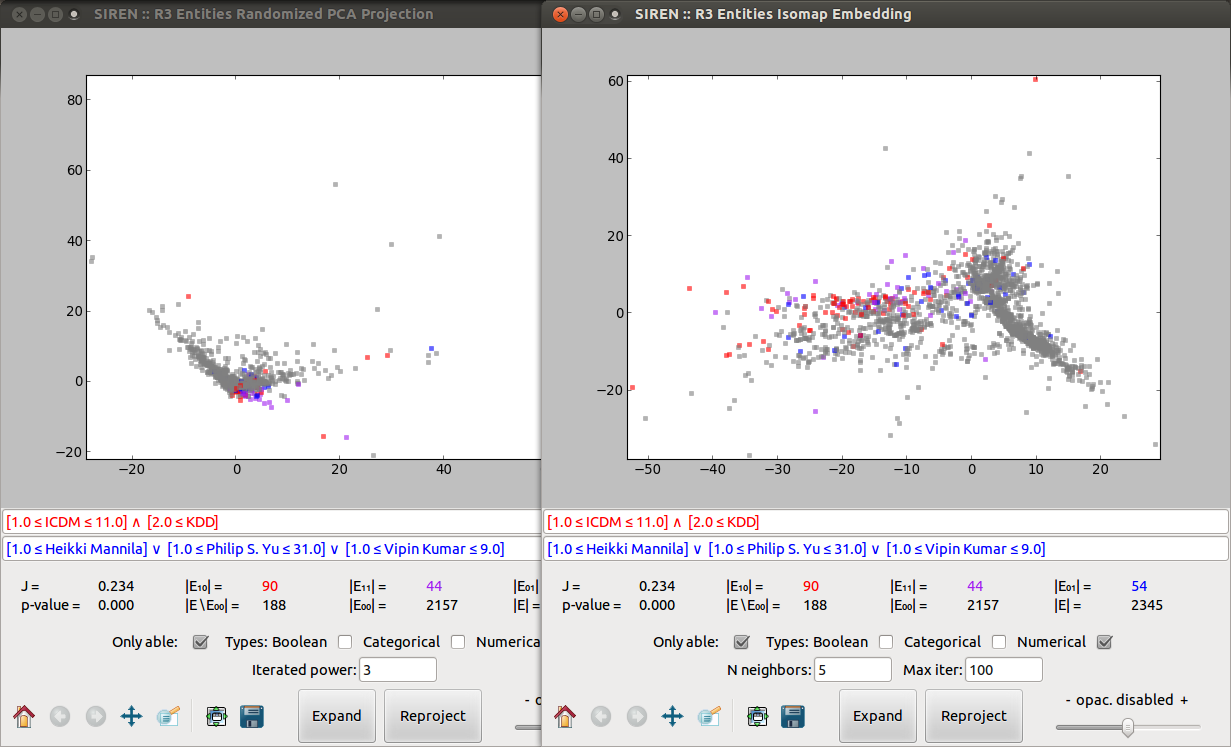
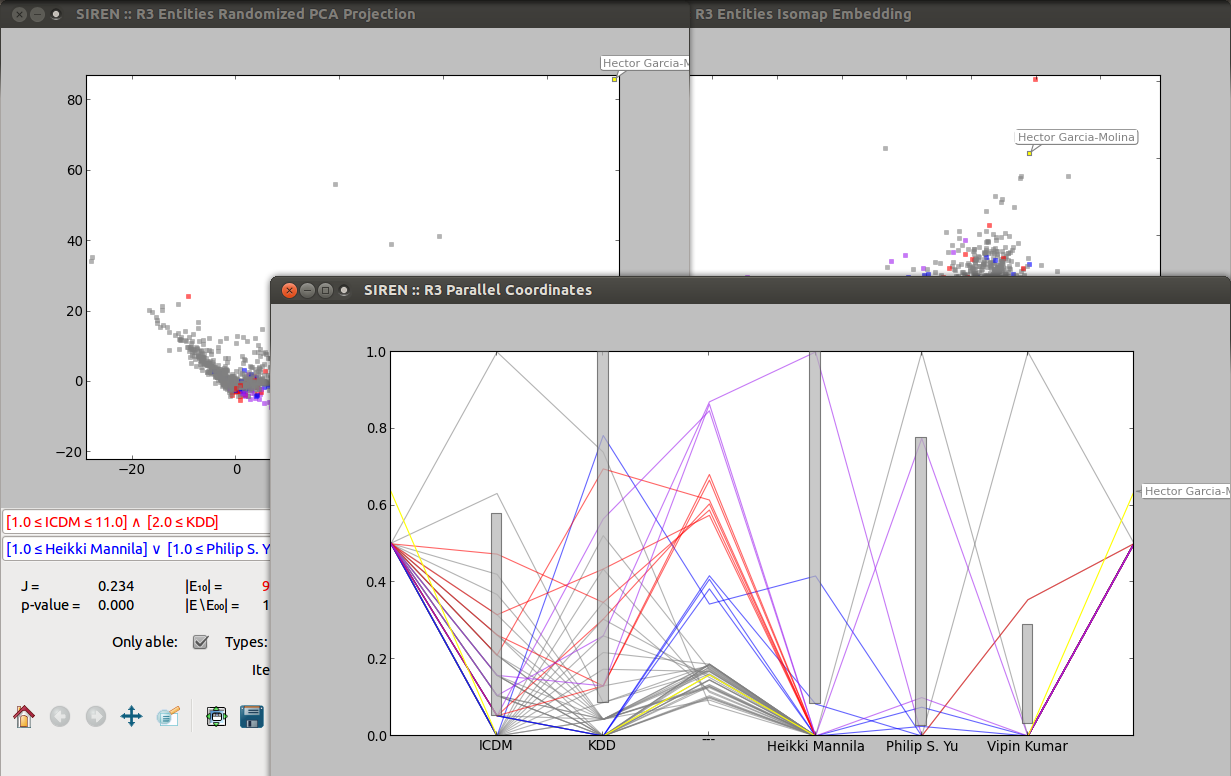
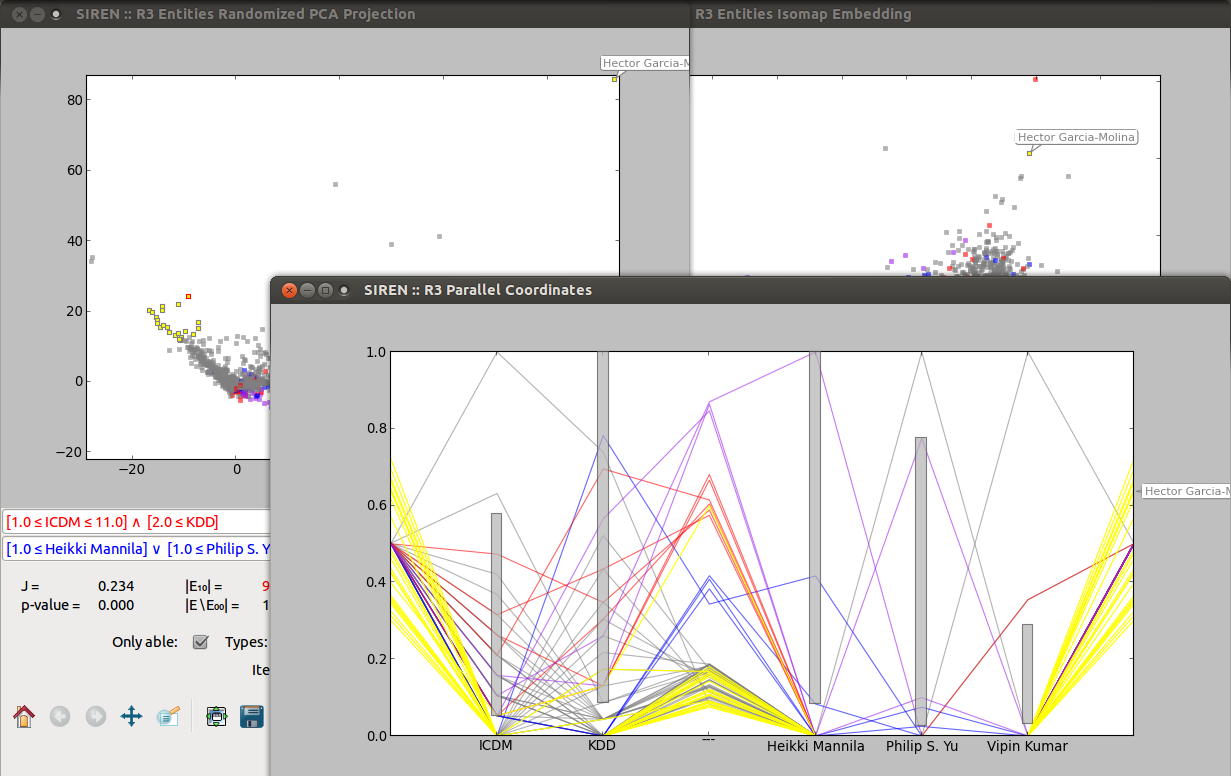
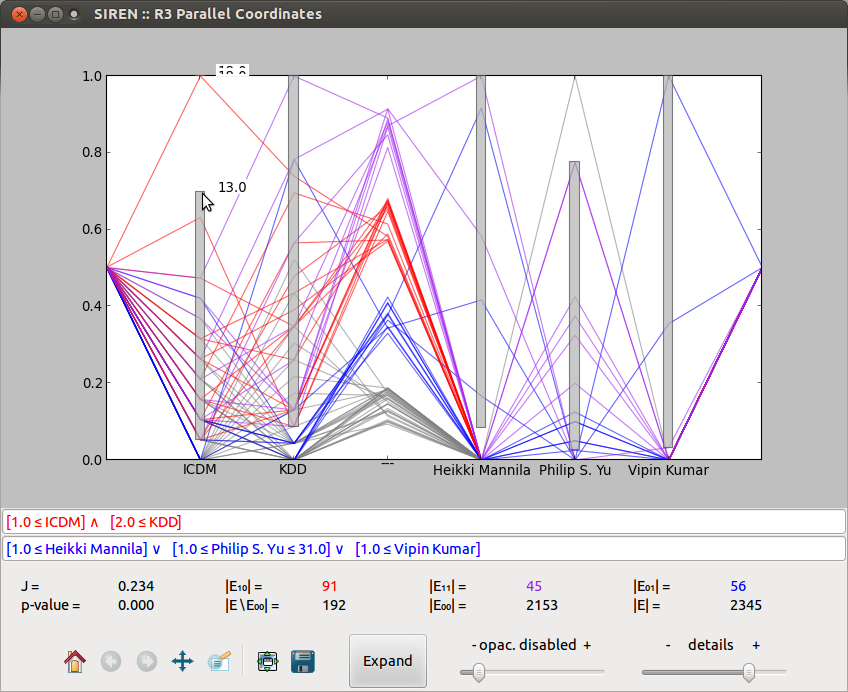
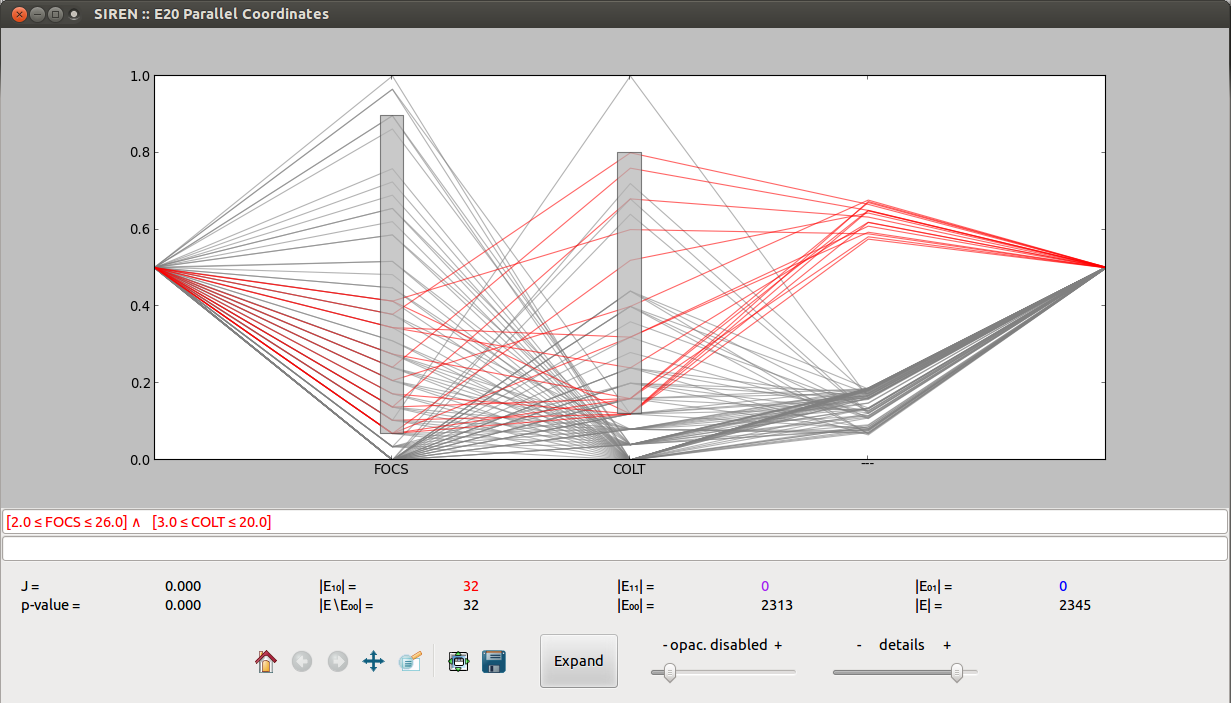
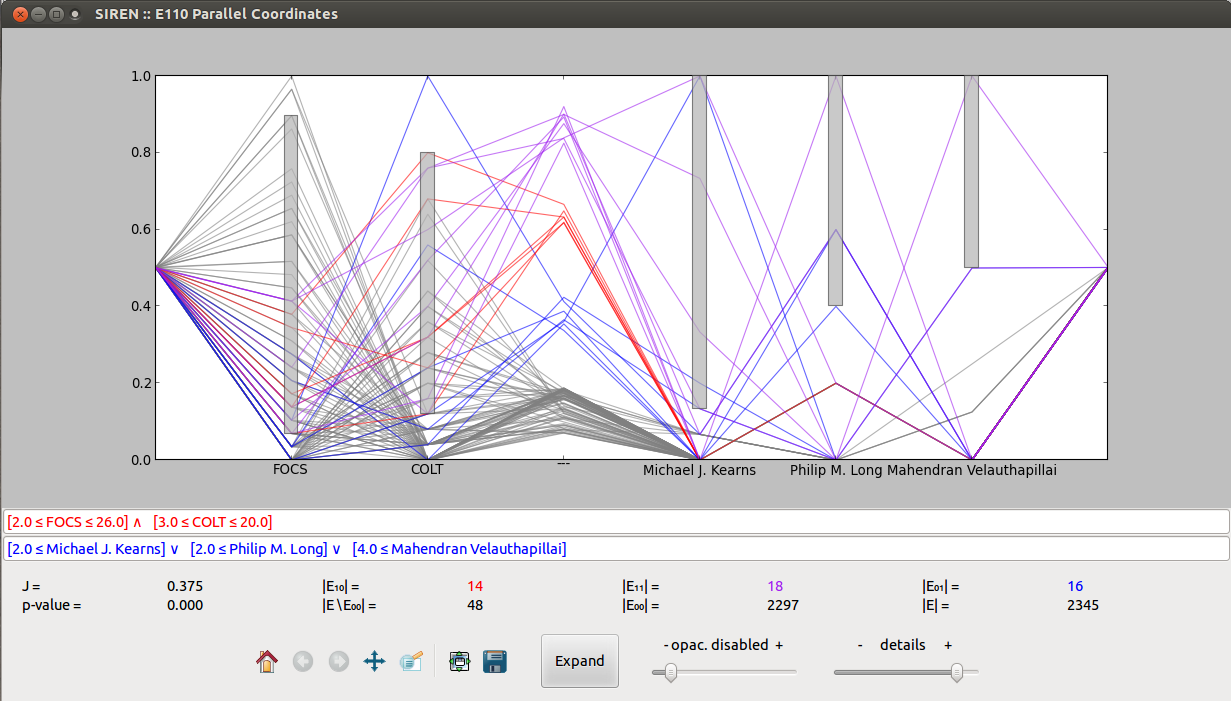
In this third example, we consider non-geospatial data, namely from the DBLP Computer Science Bibliography.
This dataset comes from the DBLP data base of computer science bibliography. Here the entities are researchers, the left-hand side data indicates major CS conferences in which they have published while the right-hand side data contains co-authorship information.
Unlike in the previous examples, the entities in this data are not associated to goegraphic coordinates, hence this data is not geospatial and the redescriptions cannot be plotted on maps. However, the other visualizations can be used for exploration.
Note
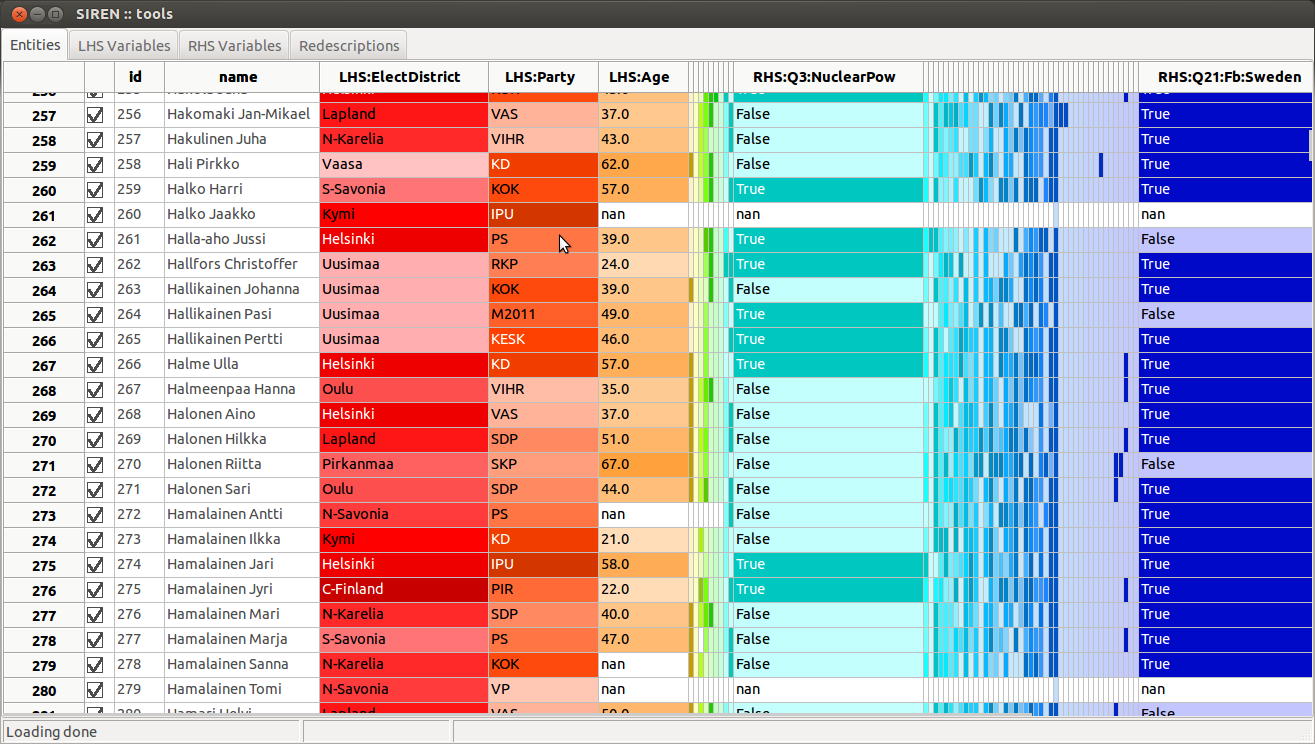
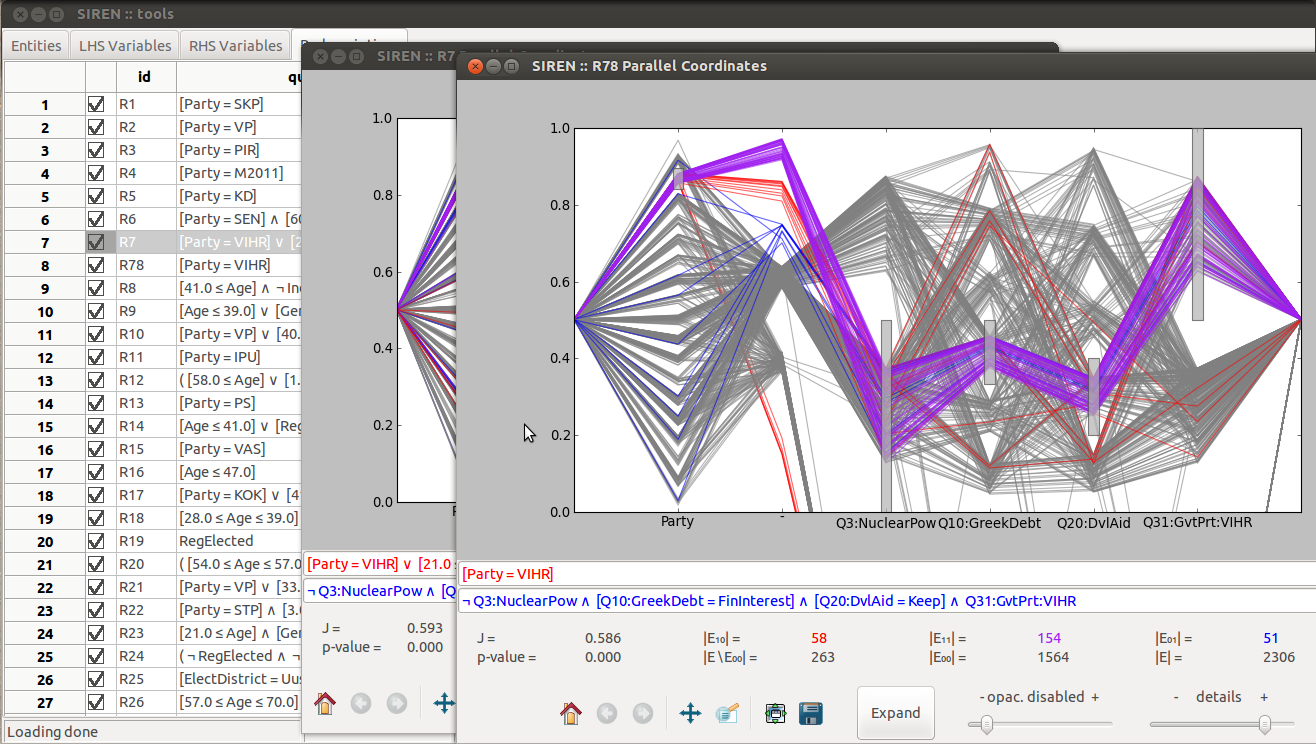
In this use case we consider the case of exploring open data about the candidates to a national election using redescription mining [F.3] .
The prepared dataset is available here.
The data was collected from www.vaalikone.fi, the election engine of the Finnish newspaper Helsingin Sanomat and made publicly available. One view contains candidate personal profile attributes, such as party, age, and education, while the answers provided to 30 multiple-choice questions and assigned importance form the other view.