|
Interactive
Animated Problem Sets in Learning
Functions
and Binary Operations
|
|
Martti
E. Pesonen and Hanna Lehtola
Department
of Mathematics
University of Joensuu
Finland
|
Abstract
We describe
the computer based learning activities meant to extend and reinforce our
new students understanding of the definitions of function and binary operation,
and discuss some aspects of the outcomes, e.g. how the students managed
in doing the activities and what they thought about them.
1. Background
The
Department of Mathematics takes care of the mathematical education of secondary
and tertiary level mathematics and science pre-service techers at the University
of Joensuu. General education and didactics of mathematics are traditionally
taught in the Faculty of Education, but there is a strong tendency to integrate
pedagogical issues in the subject studies, too. One aspect aiming to this
is the use of computers in teaching and another is more activating and
student centered approach, and these two fall together in the way we describe
here.
A
viable understanding of the concepts "function" and "binary operation"
constitute a necessary background for learning undergraduate mathematics.
Therefore, we have tried to "implicitly force" the students to rethink
the definitions, especially the role of sets; the domain and the range/image.
In
October 2001, before they had learnt anything about functions after school,
our freshmen had a three hour computer lab where we used an html-form containing
Javasketchpad applet based interactive animations combined with problems
targeted to clarify different aspects of the function definition. In these
worksheet the students can "play" with the mathematical objects, like in
e.g. Geometer's Sketchpad or Cabri, but they only have very restricted
tools. Tools may be dragging points, controlling an animation with buttons
or mixing these two, using dragable segments for measuring or receiving
hints or warnings as response to their actions. The pedagogical background
comes from the work of Shlomo Vinner & al. concerning "concept images"
and concept definitions, combined with the use of verbal-symbolical-graphical
representations of concepts in concept formation, which has been investigated
for example by my colleague Lenni Haapasalo in the framework of locally
radical social constructivism.
2. WWW-Javasketchpad
worksheets
The
computer activities were planned to be carried out either as guided computer
lab work or as homework, simulating distance learning. Therefore we used
html-documents and the Java applet Javasketchpad of Key Curriculum Press,
lurking on our www-server. The applet constructions, (dynamical interactive
pictures which we call here sketches), and the problems are
integrated in the html-form so that the students can send their anwers
to the teacher by a single push of the Send button in the end of the
document. The answers can be of multiple choice, short input or text area
type, and after sending the students answers are shown. On this Form
Mail document also the correct answers can be shown if appropriate.
A Javasketchpad sketch
can contain geometrical elements such as points that can be dragged using
the computer mouse, lines, rays, segments, circles and more advanced constructions
that can depend on the points or calculations, control buttons for showing
and hiding objects or moving or animating them, see Figure 1. The sketch
can also contain text and gif-figures. Sketch codes can be generated automatically
by Geometers Sketchpad or programmed by hand using the construction language,
which we have used because of more precise output and control of the command
structures. The code is sent as a parameter to the applet, and the resulting
sketch is shown by the browser on the computer screen as a part of the
html-form which also contains the appropriate problems.
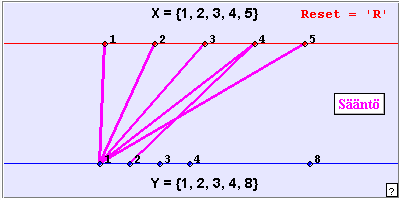
Figure 1.
An applet construction
3. Structure
of the whole demo
The
Pre-test
The
three hour demo was started by a half an hour paper-and-pencil Pre-test
to see what the students knew about functions on the basis of school mathematics.
Most problems were of definition identification type, using graphical or
verbal representations of the candidates. They also had to choose whether
the following statements concerning functions aretrue
or not:
a)
For each value of the variable the value of the function is always different.
b)
No element of the domain set can be mapped to an element of the same set.
c)
No element can have more than one image.
Finally they were asked to write
down the definition of function as they knew it.
We got the following results:
a) correct 61, wrong 13
b) correct 36, wrong 38
c) correct 46, wrong 27, no answer 1
Function definition was expressed correctly by 18 students,
half correct by 19 and wrong by 30; seven students gave no answer.
The
Function Demo
The
most extensive part of the activities was the interactive computer-based Function
Demo,
which took about two hours of intensive workIn
the worksheet the problems range from Venn-diagram-like pictures where
arrows show the rule, to traditional coordinate representation in the plane,
and finally to parametric vector-valued functions of one real variable.
In some problems we asked whether a shown dynamical graphical representation
describes a function, and if not, why. In many problems the domain and
range were asked for, and in some the function rule itself was asked to
be explained using a symbolical formula and/or own words. Another worksheet
Function Repetition 2 extends to real- and vector-valued two variable functions
and binary operations in the plane.
The
Post-test
A
week after the computer lab session students had to fill in an online Post-test
where again some identification problems were posed. We also asked for
a detailed student evaluation of one particularly problematic applet construction
in Problem
7
of the Function Demo and some more general feedback. The Post-Test is found
at
We
discuss and compare the results of the Pre- and Post-tests in section 5,
after describing the Function Demo itself.
4. The
Function Demo
The
Function Demo worksheet is found at
We
received 74 email answers to the problems, two of which were incomplete
because of some technical problems. The worksheet contains 17 Javasketchpad
sketches, which fall into different categories according to the following
table of contents:
I
Definition of function: domain - rule range
(problem sets 1-5)
Definition
of function (text)
Different
representations 1-4
Bijection
5
II
About graphical representations of real functions
(problem sets 6-15)
One
dimensional axis-to-axis representation 6-10, feedback
Plane
curve representation 11-12
Examples
(power, root, exp, log) 13-15
III
About vector valued functions of a real variable (problem sets 16-17)
Plane
curve 16
Motion
in the plane 17
IV
Student feedback (text area)
Problem
sets 1-5
The
elementary problems 1-3 were very well done, although in 3a and 3c ten
students failed, and a reasonable verbal expression was produced by 2/3.
Problems in 4 (see Figure 1) and 5 were solved correctly by about 80%,
except the production of verbal and symbolical representations in 4c, 4d
and 5c, which were solved by only 30%. Also in 5d, less than half could
restrict the domain to get a bijection.
In
all graphical expressions the results were better than in the Pre-test.
Problem
sets 6-10
In
sketches 6-10 (see Figure 2) the function acts between two parallel real
lines, the upper containing the domain. All domains are intervals, but
values may be intervals, discrete (7), multiple (9) or exceed the real
line (10). There are two ways to arrange the restrictedness to an interval,
either the variable is bound to an interval or there is no image when the
variable goes outside the domain.
In
different sketches different tools are available:
6:
Function: continuous, periodic; Buttons: animate, ticks, restrict, trace
7:
Function: discontinuous, discrete; Buttons: values, ticks, trace
8:
Function: continuous; Buttons: values, ticks, trace
9:
Relation: two-valued; Buttons: values, ticks
10:
Function, not real-valued; Buttons: animate, ticks
The
problem sets 6-8 were about properties that they know from school: domain,
image/range, values, extrema, monotoneity, continuity. These were successful,
in general.
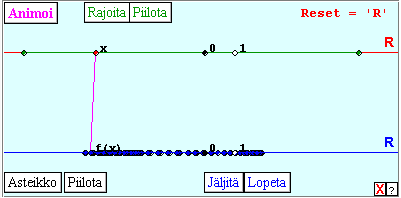
Figure 2.
Sketch to Problem Set 6
The
most difficult was 7e: Is the function continuous?, less than a half
managed. This may be partly because of the strange representation; there
are no visible gaps! Also 6f, the image of [0,1], was not managed by
some 10%, likewise 7b, 7c and 7d. Problems 9 and 10 were clearly not functions,
which 20%-30% (confused?) students could not find out or explain correctly.
Opinions
about axis-to-axis-representation
In
the middle there was a special feedback part, where we asked for students
opinions about how well the one-dimensional axis-to-axis representation
suit for solving typical real function problems:
1.
Function values
2.
Domain and image
3.
Understanding the trinity domain rule range
4.
Bijectivity
5. Increasing/decreasing
6.
Maxima and minima
7.
Boundedness
8.
Periodicity
9.
Continuity
10.
Differentiability
11.
Sign of derivative
12.
For what it suits especially well/poorly?
Great
majority of students appreciated the representations suitability for problem
types 1, 2 and 6, and in only problem types 8, 10 and 11 more students
rated it poor than good.
Problems
11-12
The
sketch 11 animates a process where axis-to-axis representation transforms
to conventional coordinate system. The functions and problem sets in 11
and 12 are the same, the essential difference is that in 11 the graph ja
tracing are not available. Here the results are almost equal and expectedly,
differentiability (g and f) is the most difficult problem.
Problems
13-15
In
some problems one could get 0, 1 or 2 points, e. g. if there was some extra
information in the answer. Both 1 and 2 points can be regarded as managed.
Concrete
and familiar power&root, exponential and logarithmic functions were
treated in a satisfactory way. Here the sketches contained the variable
on the horizontal x-axis, and a parameter (r or a)
changing the function was in an extra real line in the lower end of the
sketch. The problems were of quite traditional nature and the sketch tool
helpful, except that the poor handling of singularities caused some strange
effects in the sketch, and the problems of symmetry of graphs raised confusion
for the students (see Figure 3).
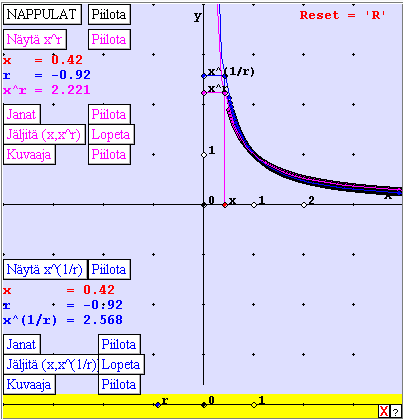
Figure 3.
Power and root functions interactively (sketch 13)
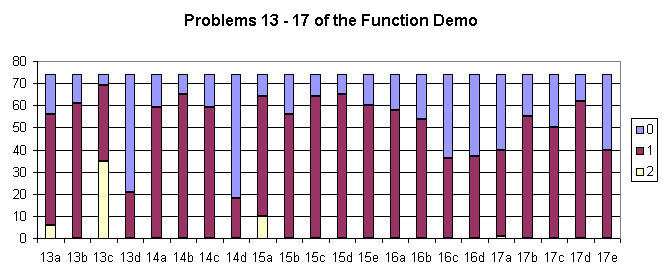
Figure 4.
Part of students achievements
Remark
By
now many students began to be exhausted, and for learning new things this
certainly was not the best time. But this was part of the experiment, to
see how much they can be expected to stand!
Problems
16-17
The
sketches now turn to vector-valued functions. In 16, it is shown how axis-to-axis
representation of two functions to separate range lines are turned to the
parametric interpretation. Values and pre-images were found by 75%, while
half of the students identified the component functions among the given
three trigonometric candidates (see Figure 4).
In
17 the same framework is used to illustrate time-depending two-dimensional
motion. The problems are very elementary; to measure distances with a dynamical
ruler tool and to make sense with when the particle is at certain point
in the plain, finishing with dealing with periodicity. At least half of
the students managed with all these problems, the measuring being achieved
best.
Student
Feedback
The
lengthy worksheet ended with an open ended Student Feedback text area starting:
I
think that ....
In
general, the feedback was positive. Most frequent students expressions
about the demo were:
·
good variety, good for a change (19)
·
good (15)
·
nice (8)
·
useful, beneficial (7)
·
clear, concrete (6)
·
interesting (5)
Students
also complained or gave suggestions:
·
too much work in one worksheet (19)
·
things should be first taught during the course lectures (15)
·
the worksheets should contain more: hints (10), theory (6), explanations
(5), examples (4)
·
animations should be clearer (8)
·
improve problem setup (7)
·
better feedback from the teachers side (7)
·
improve user instructions (6)
·
improve user interface (4)
5. Comparison
of Pre-test and Post-test
Although
the main purposes of the demo were to test the technical and pedagogical
functionality of the worksheet and to see how the students manage with
it, we also wanted check whether their knowledge and skills seemed to improve.
In
both tests there were some nearly similar problems.
Problem
type
|
Pre-test %
correct
|
Post-test %
correct
|
|
Traditional
graph (4K and 1a, two-valued)
|
32.4
|
77.5
|
|
Traditional
graph (4K and 1d, sub-interval)
|
32.4
|
43.7
|
|
Verbal
(2a and 2a, function)
|
94.6
|
100.0
|
|
Verbal
(2c and 2c, not a function)
|
8.1
|
19.7
|
|
Verbal
(2b and 3c, not a function)
|
56.8
|
71.8
|
|
Verbal
(2b and 2b, not a function)
|
56.8
|
56.3
|
|
Verbal
(2d and 2d, not a function)
|
74.3
|
59.2
|